Just Released: Blackbaud Institute’s 2019 Charitable Giving Report
The Blackbaud Institute has just released The 2019 Charitable Giving Report . It is not only vastly improved over previous editions but sounds an optimistic note in the cacophony of fundraising prognostications that often sound more like a dirge than a paen to progress.
This year’s Report includes giving data from 8,210 nonprofit organizations representing $36.3 billion in fundraising revenue as well as online giving data from 5,204 nonprofit organizations representing $2.7 billion in online fundraising revenue. You can download the Report here.
After years of reporting data on a “what’s up, what’s down” basis –this year’s compared to last year’s–the new format offers more valuable insights and data. For example, it wisely goes beyond the short-term, one-year view to also offer a more meaningful long-term or rolling three-year view of results.
This rolling three-year view is particularly important given events of the past three years. The election of President Trump and the so called “Trump Bump” and the 2018 Tax Reform Act.
You’ll recall the wave of dire predictions of precipitous drops in giving because of the tax reform. To paraphrase Mark Twain, the report indicates the death of philanthropy as we knew it was highly exaggerated. Over the three post-election years and two post tax-reform years the one-year trend for giving is up 1% and the three-year trend up 5%.
Key Takeaways from the The 2019 Charitable Giving Report
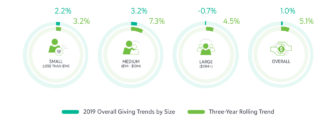
- A 3-year view of fundraising from the same organizations reveals a 5.1% growth in overall giving and an increase of nearly 10% for online donations.
- Online giving in 2019 grew 6.8% year-over-year for the 5,204 nonprofit organizations in the analysis, while overall giving in 2019 grew 1.0% for the 8,210 nonprofit organizations included in the report.
- The percentage of fundraising from online giving continues to grow with 8.7% of total fundraising stemming from online giving in 2019. Additionally, small nonprofits continued to show the largest year-over-year growth in percentage of total fundraising stemming from online giving.
- In 2019, an estimated 26% of online donations were made using mobile devices. This has grown steadily since 2014 when it was just 9% of online donations.
- While the median donation amount for gifts below $1,000 in the U.S. has remained steady at $20 for years, the median donation amount for gifts above $1,000 in the U.S. has more than doubled since 2016, now clocking in at $2,500.
- The average donor age in the U.S. remains largely unchanged at 63, which has been consistent since 2016 giving statistical credence to Jeff Brooks’ admonition that a “young donor” is someone who is 40-50 years old.
How to Benefit From This Report
As a member of the advisory panel of the Blackbaud Institute I’ve seen first-hand the thought and work that goes into making a report like this useful to fundraisers, boards and CEOs. And, in this year’s edition Steve MacLaughlin and the Institute team who worked on the Report offer insights and recommendations on its use.
[ BTW the Institute has also launched a new Knowledge Base you should check out. Called The Explorer , in it you’ll find a wealth of tips, analytics, and statistics on a wide variety of practical fundraising practices.]
Not only can you use the trend data in the 2019 Report to benchmark your own organization’s performance (the benchmarks are organized both by size and type of organization) there’re also highlights on practices all organizations should be using to attract, engage and retain donors.
If you’re into benchmarking a new feature in this year’s Report is the measure of average donation size by type or sub-sector of organizations. This distinction is important either for those about to slit their wrists unnecessarily or, more likely, bask in the glory of mistaken modesty because they “beat the benchmark.”
For example, across all subsectors the average donation amount in 2019 was $617. BUT…there is significant variance among different subsectors principally because there are some organizations with large numbers of major donors. For instance, Higher Ed organizations have an average donation of $1449 compared to $273 for Animal Welfare nonprofits.
In short, the tables and charts in this Report are more than a mere glimpse of current stats – – they represent an opportunity to see where giving is currently– – and more importantly where it can go if this data is used to inform strategies and approaches.
Some Problems. Some Hope. Lots of Change.
Sadly, RETENTION continues to be a problem—mainly where first year donors are concerned.
- “Online – Only” retention rate for first-year donors was 24% in 2019. 63% for multi-year online only donors.
- “Off-Line Only” retention rate for first-year donors was 27% in 2019. 57% for multi-year donors.
Although at The Agitator we continually note that online giving is but a fraction of overall giving it is encouraging to note from the Report that in 2029 it reached the level of 8.7% of the total fundraising pie. To put this in perspective it is worth noting that despite all the attention given to Amazon and other e-commerce efforts the U.S. Department of Commerce reports that online/e-commerce accounts for only 11% of total U.S. retail sales. So, by comparison there are signs of hope we’re getting to that level.
When I discussed the Report and its trends with Blackbaud’s Steve MacLaughlin, he not only noted that “change seems to be the only constant” he also pointed out that the most significant growth is occurring in those sectors where there is a confluence of public sentiment and fundraising innovation. For example, nonprofits concerned with environmental issues (climate change) grew by 8% last year and animal welfare by 12% compared to overall growth in 2019 of 1%.
He noted that because newer organizations and issues usually don’t have large existing donor bases, they are forced to innovate far more than larger, long-established organizations. This thought, and just how much shift in giving is occurring because of new issues and innovation is worth pursuing in future posts.
Whatever the cause or reason the Report does makes clear that small and medium sized organizations in the animal welfare and environmental space are growing while faith based, health care and higher ed oriented organizations have grown far less, plateaued or declined. (Perhaps more innovation is needed there?)
I recommend you take some time, read and think about the findings of The 2019 Charitable Giving Report and then share your observations with us.
Roger
P.S. For Agitator readers in Canada, U.K., Australia and New Zealand The 2019 Charitable Giving Report contains a summary of 2019 overall and online giving in your country.
2 responses to “Just Released: Blackbaud Institute’s 2019 Charitable Giving Report”
Behavioral Science Q & A
Integrating an individual giving appeal with other communications from a charity can have both positive and negative effects, and the outcome largely depends on how it’s executed. Advantages of Integration Brand Consistency: Maintaining a consistent appearance and messaging across all communications can reinforce the org’s brand identity and strengthen brand recognition and trust among your […]
Read Full Answer
I’m not aware of any in-market tests specifically comparing recurring vs. gift frequency language. I suspect the answer might not be the same with all gift frequencies, nor with all people. It sounds like a great opportunity for you to test and find out what works for your audience. Based on the literature, here’s a couple […]
Read Full Answer
Based on what we know from existing data, those renewal notices can actually be pretty effective in getting people to donate. They tap into our psychology – creating a sense of urgency, reminding us of past support, and using personalization to make the message hit home. They’re playing on our natural tendencies to feel obligated […]
Read Full Answer
Interesting question. I had a quick look at the testing done on this topic. On the positive side, in all cases, over half of donors decide to cover the fee. In some cases, it goes as high as 65%. Not a negligible percentage at all. Here’s another test from iRaiser showing consistent results (see point […]
Read Full Answer
There’s just one thing to consider when designing a supporter journey: the supporter. More specifically, you need to take into account: Who the supporter is i.e. their identity, which is the reason they support this cause, and their personality, which describes the way they “see” and process the world. These will determine the kind of […]
Read Full Answer
I’m not an expert in this but a quick search surfaced this article on the effect of tax reforms on 2019’s charitable giving. The researchers didn’t find a reduction. Actually, they observed an “increase in charitable contributions in 2019, even with the lower tax rates and the dramatically smaller number of taxpayers who itemize their […]
Read Full Answer
Thanks for sharing Roger. It will be interesting to compare the results with the FEP report coming out in the near future…
[…] Institute has just released The 2019 Charitable Giving Report. What do you need to […]