Testing Goes To Pot
Last year, the Journal of the American Medical Association for Internal Medicine published a blockbuster finding – April 20th has a 12% elevated fatal crash risk, which is statistically significant. This doesn’t sound like a blockbuster finding until you factor in that April 20 is also a very unofficial holiday for using marijuana. The authors claimed that this likely indicates marijuana use doubles your fatal crash risk.
A statistically significant result. Case closed. Right? That’s often what we would do in our direct marketing test: we get a result, it differs from the control, we call it, and we move on to the next result.
But it’s important to think about what statistical significance means. Steve Rudman of Concord Direct illustrated this well on a recent webinar. He had a clear winner in his three-panel test. The only problem was the printer had accidentally sent out the same piece to all three groups. There was a statistically significant difference in results, but no difference in the mail pieces. I talk about the same thing here – a 15-panel test I did with the same package being mailed out that showed wide variations in average gift and response rate.
So, statistical significance at a .05 level means there’s a 5% chance that the results could have happened by random chance.
Going back to our JAMA/April 20 study, there are 365 days in the year. That means if crash risk were completely random, there should be about 18 days that have a statistically significantly elevated crash risk. That’s kinda what random means.
Well, here’s what happens if you look at every day using the methodology from the original JAMA article (thanks to this article for the analysis):
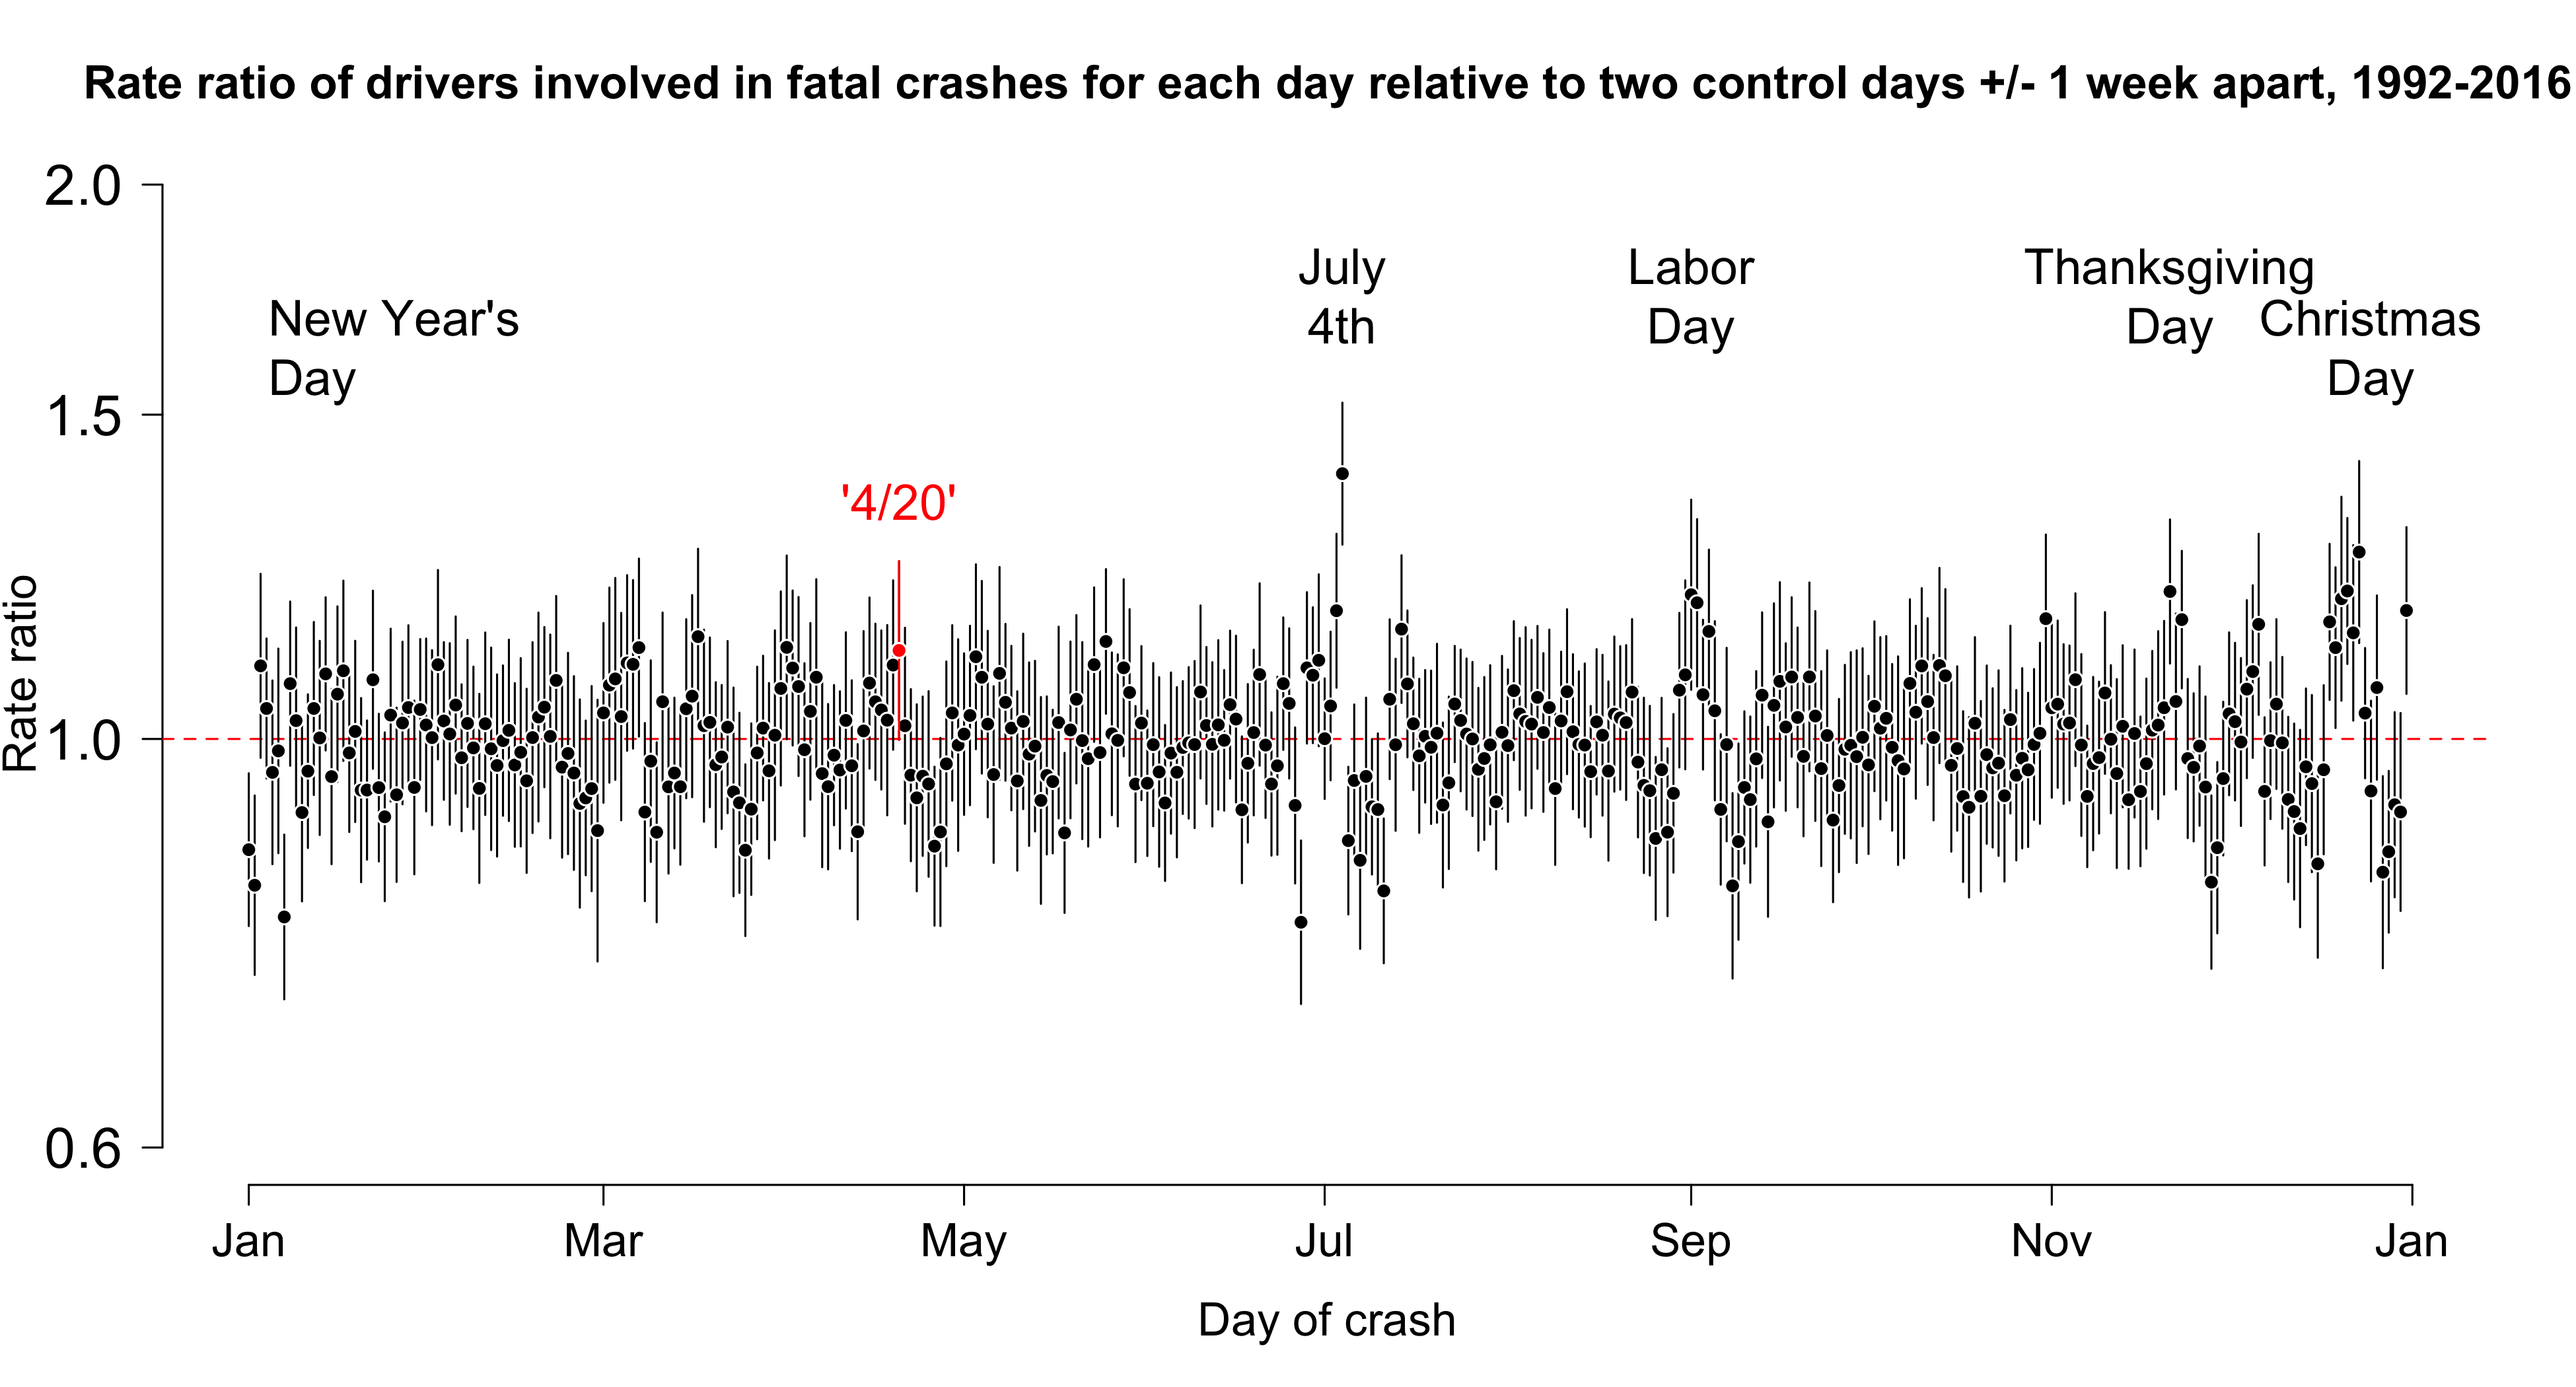
Turns out 20 days had a higher relative crash rate than April 20th. The list is part days where people have days off and no familial obligations – aka drinking holidays – like Fourth of July, the Third of July, Halloween, New Year’s Eve, and days on which Memorial and Labor Day often fall and days where no explanation jumps to mind. I don’t think we going to be seeing a “December 6th is one of the deadly days on the roads” PSA any time soon, but it has statistical significance over time just like 4/20.
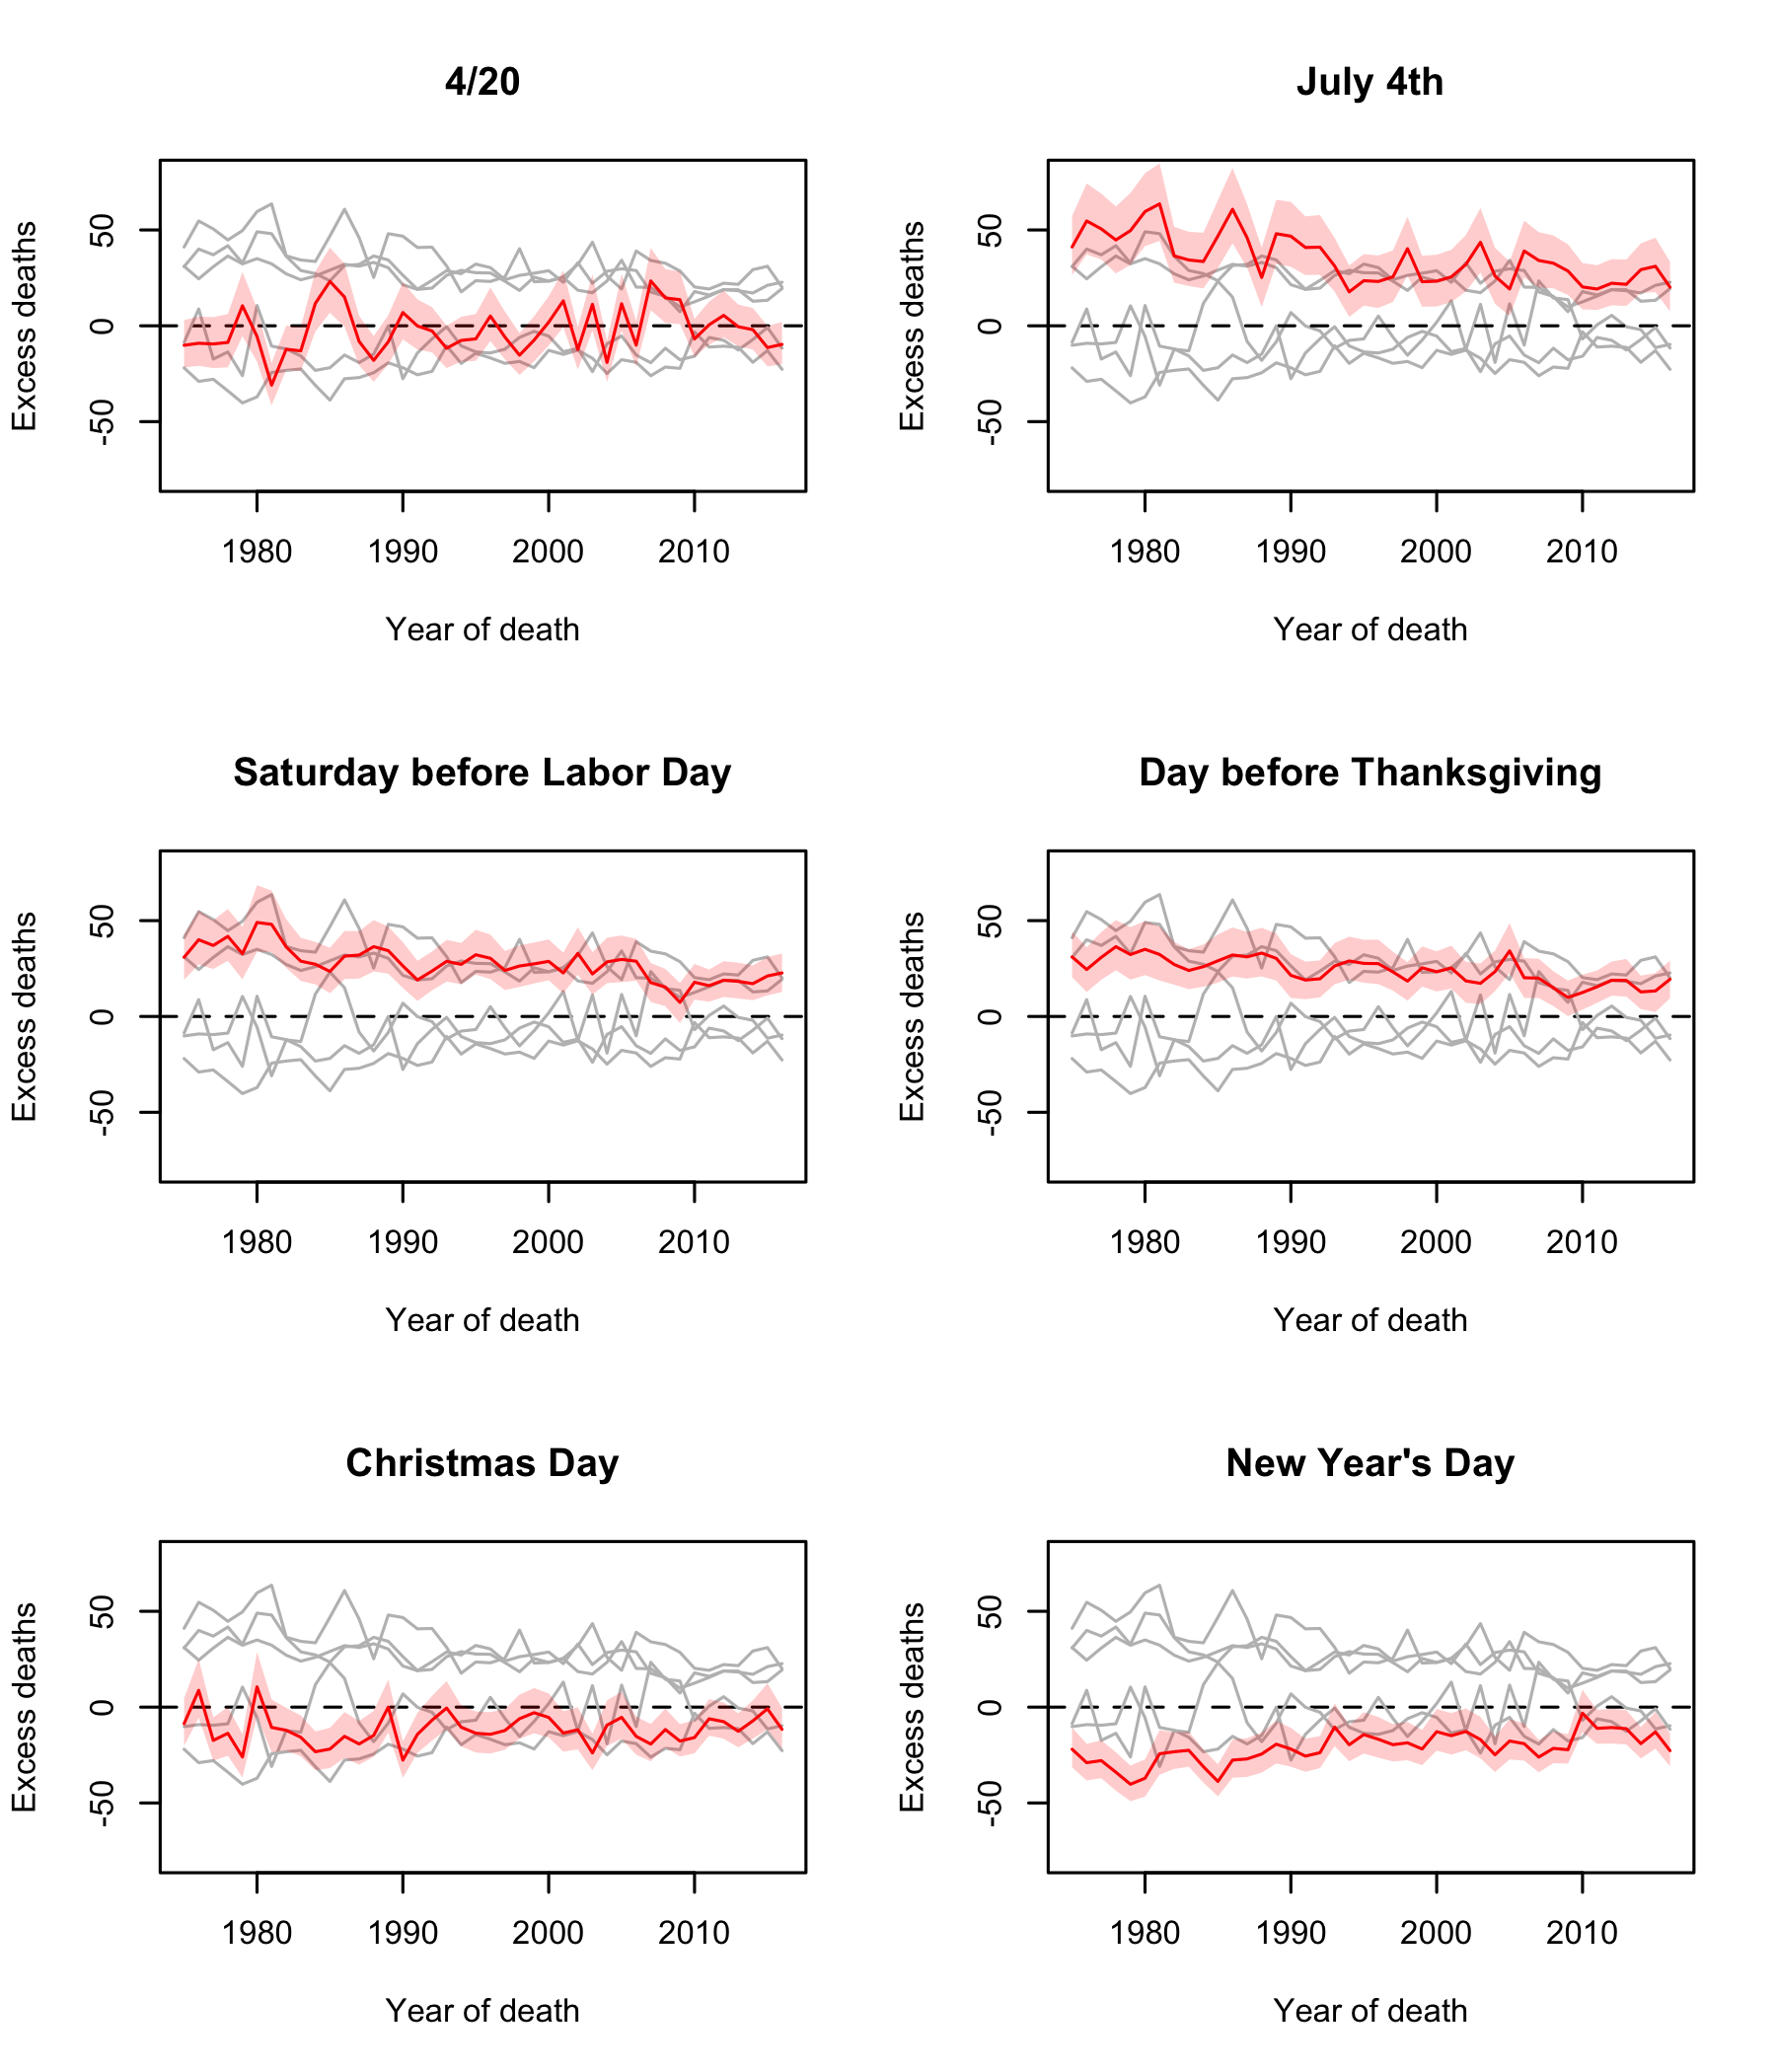
So let’s think about this. 4/20 as a “holiday” became more widespread in about 2006. Did we see fatal car crashes jump up around then? No. But we do see other holidays with more persistent effects over time:
So what’s the answer? I don’t know for certain. And that is, and should be, our answer for many things in our testing.
Because random chance happens. Even if you did three tests independently that had statistical significance at the .05 level, there’s still a .0125% likelihood that it happened randomly.
By the same token, if you come up with a result that isn’t statistically significant, it still contributes to our knowledge. .05 isn’t a magic number where .049 is touched by the hand of whatever as big-T Truth and .051 is dreck.
Rather, we can all be Bayesians. Not in the sense of being the English clergyman whose greatest contribution to knowledge is published after death. But using the spirit of the Bayes Theorem that talks about certainty. To de-math the theorem, it says:
Old belief + new evidence * the strength of that evidence = new belief.
And all these beliefs are somewhere between certainty yes and certainty no. Every belief is a shade of grey.
We have beliefs. We run the tests not to prove or disprove our beliefs, but to add or subtract support from them.
It’s also why we try to either go inexpensive with our testing with Facebook ads (some interesting tests from Kiki Koutmeridou from last week’s Behavioral Science Symposium here) or broad with our testing as with the DonorVoice Pre-Test Tool as demonstrated here.
And if you’d like to see this type of Bayesian thinking in action, I recommend Erica Best’s presentation from the Symposium below. They saw data from research that their initial approach wasn’t optimal. They tested it in the Pre-Test Tool. Then they did five live mail tests and one online ad test on it. There were five tests in support and one with mixed results, but they think they know why that happened, but they are going to test that hypothesis:
It’s a great example of a cycle of testing, learning, and refining that we can all model.
Nick
P.S. An aside from this former traffic safety guy to interject: pot-impaired driving is just that– pot-impaired. You’ve probably read enough drug labels in your life that your prior knowledge is that putting mind-altering chemicals into your body and then piloting any form of craft don’t mix. As to the literature, there’s debate over the level of impairment or the increase in crash risk, but there’s not much uncertainty as to whether it is impairing. So please don’t drive high.
2 responses to “Testing Goes To Pot”
Behavioral Science Q & A
Integrating an individual giving appeal with other communications from a charity can have both positive and negative effects, and the outcome largely depends on how it’s executed. Advantages of Integration Brand Consistency: Maintaining a consistent appearance and messaging across all communications can reinforce the org’s brand identity and strengthen brand recognition and trust among your […]
Read Full Answer
I’m not aware of any in-market tests specifically comparing recurring vs. gift frequency language. I suspect the answer might not be the same with all gift frequencies, nor with all people. It sounds like a great opportunity for you to test and find out what works for your audience. Based on the literature, here’s a couple […]
Read Full Answer
Based on what we know from existing data, those renewal notices can actually be pretty effective in getting people to donate. They tap into our psychology – creating a sense of urgency, reminding us of past support, and using personalization to make the message hit home. They’re playing on our natural tendencies to feel obligated […]
Read Full Answer
Interesting question. I had a quick look at the testing done on this topic. On the positive side, in all cases, over half of donors decide to cover the fee. In some cases, it goes as high as 65%. Not a negligible percentage at all. Here’s another test from iRaiser showing consistent results (see point […]
Read Full Answer
There’s just one thing to consider when designing a supporter journey: the supporter. More specifically, you need to take into account: Who the supporter is i.e. their identity, which is the reason they support this cause, and their personality, which describes the way they “see” and process the world. These will determine the kind of […]
Read Full Answer
I’m not an expert in this but a quick search surfaced this article on the effect of tax reforms on 2019’s charitable giving. The researchers didn’t find a reduction. Actually, they observed an “increase in charitable contributions in 2019, even with the lower tax rates and the dramatically smaller number of taxpayers who itemize their […]
Read Full Answer
Consider, too, that many of those special holidays may have elevated amounts of driving behavior (more people traveling to in-laws for dinner, or to the airport to travel, etc.). This may be offset by a reduced amount of “standard” driving, too.
Unless you have a standard baseline (like # of miles driven per day), just having the variation per day, even if it gives a statistically significant result, doesn’t say that much.
Reminds me of the XKCD comic about jelly beans and the dangers of the “only statistically significant results are publishable” culture which has developed in the scientific community.
https://www.xkcd.com/882/
Thanks for the reminder that there are many ways to view your results, and not all of them mean the same thing.
Exactly – when you look at fatalities per vehicle mile traveled (VMTs), the deadliest days are usually like a Fourth of July when people tend to travel (increasing the VMT) and drink (increasing the risk).