Cluster Analysis or Cluster F***k?
Don’t shoot the profane messenger. If you ever think about or talk about or actually perform donor segmentation, you’ll want to read this post about a statistical technique called cluster analysis.
It is time to sound a warning bell for what might be a largely unnoticed, but no less severe, epidemic of shoddy cluster analysis being done by folks who seem to have access to a black box. Sadly, they have very little understanding of what’s going on inside that box.
Let’s label this post an Agitator buyer beware, public service announcement. There are a lot of charities we know of – mostly large ones – buying very expensive clustering analysis “solutions” in hopes of developing more ‘donor-centric’ segments.(Segments that are often labeled “personas” in the inevitable PowerPoint presentations that follow).
However, when it comes to any statistical technique the details matter and the vast majority of cluster analyses we’ve seen have fatal flaws that render the output worse than useless.
We don’t expect charities to become expert in research or statistical analysis – this need is often outsourced like other tasks precisely because no organization can have in-house expertise on everything and outsourcing is often the most prudent choice. But, there are warning signs every organization should be alert to, and this post will provide your own FAQ for the next time a consultant tries to impress you with “cluster analysis”.
What Is Cluster Analysis?
Cluster analysis is used for grouping people into segments based on their underlying traits with the statistical goal of identifying people in each segment who are similar to each other in that particular cluster but different from those in the other clusters. Of course, this is also the goal and a necessary precondition for any worthwhile market segmentation – more difference between groups than within a group.
So far, so good.
The BIG QUESTION is “on what basis do you create your segments? “ What variables go into the clustering stew? How about shoe size and hat size? Absurd you say? Yes, unless you are selling hats and shoes. Well, what about demographics or attitudes about charities or the lifestyle/purchase/giving behavior data you buy on the 3rd party data market?
The single biggest, fatal flaw with the cluster analyses we’ve seen is the randomness with which that decision – what variables to use to create our segments – is made. Why does it matter? Isn’t the software with its algorithms smart enough to sort it all out? In a word, “NO!”
As we’ve noted before, software and data modeling engines can be super-fast and super dumb. For starters, they often don’t know what data and variables they are missing. This leads to lots of localized, sub-optimum answers.
Questions You Should Ask When Cluster Analysis Is Proposed
In some ways, absent human intervention, cluster analysis is even more “dumb”. The facts below ought to be unsettling enough to encourage you to pull out the suggested questions below and ask them of whomever is proposing a cluster analysis.
- Cluster analysis has no mechanism for differentiating between relevant and irrelevant variables. The choice of variables included needs to be guided by a theory or point of view. The garbage in-garbage out adage has never been more apt.
Question: What theory or point of view are you using to choose variables, and why?
- A “solution” will be produced by a cluster analysis no matter how many variables you enter (1 or 1,000) and how big or small your sample size is (2 people or 10,000 people). In addition, the output—number and profile of segments will often differ depending on what algorithm is used.
Question: What specific clustering algorithm (or combination of approaches) will you use and how will you decide how many segments are in the final solution?
Putting the cluster f**k in cluster analysis.
It should be noted that no statistic or statistical method has an opinion nor is it inherently good or bad. So how does a neutral, benign method go so potentially awry in the hands of some users?
Possible answers: some consultants don’t know what they’re doing; and more importantly they probably don’t know what they don’t know. For example, there are dozens of clustering algorithms but there is no objectively “correct” one. That said, the data should play a role in selection and regardless, it should be an iterative process with a series of statistical checks and balances.
Too often however, the data gets thrown into the black box, out comes an answer and that’s about it… As evidence, consider this direct quote from a very large agency in the charity space as they describe their approach to cluster analysis.
“We input many axes worth of behavioral and demographic information—whatever we can get our hands on—and let the data tell us where the pockets of people are.”
If you see or hear this, run, don’t walk to the nearest exit. This is randomness personified because even one or two irrelevant variables can distort an otherwise useful cluster solution.
We simply can’t underscore this admonition enough: There must be some rationale for the selection of variables.
What’s more, if the variables you use represent different data types and scales and you haven’t accounted for this, the output will be heavily biased and skewed. For example, if one of your variables has a wider range such as donor age it will have a much bigger impact on the cluster outcome than say race or gender or attitudinal measures that have a much smaller range. Not because it’s real and telling you something important about donors but because the analysts didn’t know what they were doing. Why does this happen? Because all clustering solutions use some form of virtual space and virtual distance between points to group folks together. If age runs from 18-99 that occupies a lot more virtual space than a survey measure with five response options numbered, 1-5.
We once saw a lovely PowerPoint presentation from a large, blue-chip charity (that cost tens of thousands from an outside agency) showing the results of a clustering solution with slide after slide of highly descriptive, cleverly named segments.
Each segment slide had channel preference data, motivation, lifestyle and it all seemed so perfectly intuitive and applicable. Then we noticed that amidst all these descriptors was age. And the average age for each segment was very different. In fact, you could line up all these segments based on average age and see what was hidden but now obvious – age was used as one of a myriad of random grouping variables in the clustering stew and it was dominating the segmentation.
Sadly, this charity had paid an absorbent sum to get the equivalent of an age append on their file but the insidious part is that they thought – because of all the lovely (irrelevant descriptors) – that this was a unique, valuable segmentation scheme. If you want to group people based on age (bad idea) there are much cheaper ways to get it done.
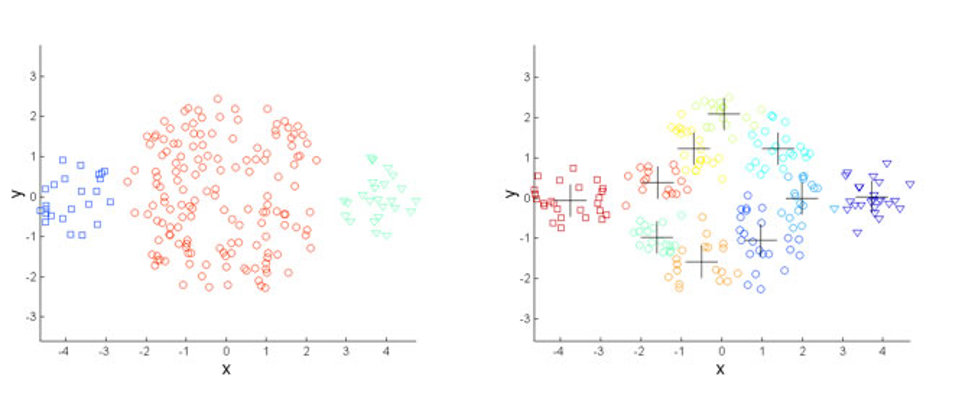
Consider the visual below. Reality is on the left. Three distinct groups that were known a priori and differed, as you can see, on Attribute X and Y. On the right, is output from a specific clustering algorithm. Three known segments twisted and contorted into noise that the analyst has unknowingly created.

And then a story is instantly created to fit or match our mind’s eye. We can describe the 11 (marked with cross) segments and how they differ (slightly) on X and Y characteristics and add a host of other random attributes to make it all seem that much more real.
To make matters more nuanced and complicated, you’ll get different non-answers and noise depending on what algorithm you use.
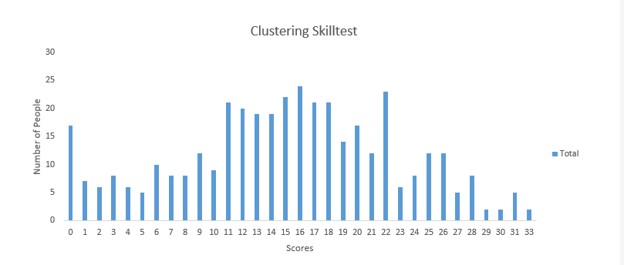
Why does this happen? Your analyst probably lives in left side of the chart below. This is the distribution of the number of correctly answered questions on a cluster analysis knowledge quiz given to over 200 researchers.
 What is an organization to do if it wants to avoid some of this expensive garbage in/garbage out analysis?
Ask these questions. You don’t have to know what the answers mean but the agency/researcher should understand the question well enough to give one and you’ll certainly be able to tell if they have non-answers, puzzled looks or a jumbled, incoherent response.
Ask,
- What clustering method (or methods ideally) do they plan to implement and why?
- How do they validate their segmentation scheme?
- What variables are they using to create the clusters and why?
- How did you account for the variables you are using having different scales and measurement methods?
Any Agitator readers care to share your experiences with using cluster analysis successfully?
Kevin


Amen to this. And I’ve seen sector bodies do this too – not just charities per se. Bodies that purport to be adding knowledge to the sectorThe disgrace there is that a funder paid for the shoddy work and smaller charities will be basing their strategy on the results. Beware. The smarter thing to do with Åge etc is to profile the segments by demographics after the segments have been created based on standardized and RELEVANT variables
[…] If you’re a seasoned fundraiser, you probably answered these questions in the usual way, that is, in terms of donor demographics and history of past giving. Many charities make use of these metrics, or at least they try. […]