Reviewing the Early Bidding: DIGITAL
Last week Kevin shared a quick review and early look on what we’re seeing in direct mail. Today, a review of what’s happening in the digital fundraising realm.
First, a look at the types of digital activity and some examples of what organizations in various sectors are sending out at this stage of the coronavirus pandemic.
Digital Activity
Once again, the folks at NextAfter have come through. Using mystery shopping they’ve produced data from 153 nonprofit organizations across 12 different verticals in an effort to answer these questions:
- What is the total weekly email volume from these organizations?
- What verticals are communicating the most?
- How has email volume changed over recent months?
- What percentage of emails are about COVID-19?
- Are organizations still asking for money, or just sending newsletters and cultivation content?
Purpose of Emails
Here’s a summary of NextAfter’s observation of the data they’ve collected to date:
- The number of emails sent each week, has been steadily increasing;
- Public Policy and International have been sending more than twice as much as verticals shown in the bottom right such as Faith Based and Public Media
- International, Human Services, and Public Media has been steadily increasing their email volume in the past three months.
- The steady increase in email volume in recent weeks has primarily been driven by messaging that includes COVID-19.
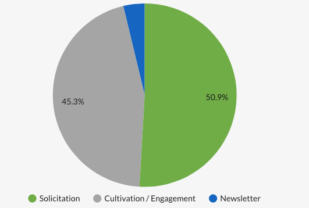
- Roughly half of all emails included some form of a solicitation.
- Most verticals had similar ratios of COVID-19 mentions with the outliers of increased mentions in Public Policyand limited mentions in Education.
- The percentage of solicitation emails has seen a slight increase in recent weeks,but the overall ratio remains roughly 50/50.
- The verticals that are directly dealing with COVID-19 such as Health, Human Services, and Public Policy are sending more solicitations than any other messaging type while many others seem to be emphasizing cultivation efforts. Environment seems to be the only outlier.
Find Information On Point for Your Organization
Using Next After’s Coronavirus Fundraising Response Resource Center you can drill in and see actual real-life emails that have been sent by organizations like yours. That way you can get new ideas to test in your messaging, content, calls-to-action, and more.
The NextAfter examples range from front line organizations directly involved in providing services directly related to the pandemic to arts and culture organizations and those in between. For example you can see what Food For The Poor is sending and also take a look at a communication from the Seattle Symphony. You’ll also find digital examples from a range of environmental, civil rights, and animal protection organizations.
You can access all these goodies and a treasure trove of other coronavirus-related content here.
Some Digital Results in the Pandemic
It will be a week or two before the Blackbaud Institute releases the most recent Charitable Index for the last quarter and the Fundraising Effectiveness Project publishes its. [Note: It’s likely the digital returns will be up and mail returns down because of the lag time in the delivery and return of postal mail. Mail returns are an important part of these indexes.]
Meanwhile, in the absence of a mass of data from across many sectors and properly analyzed here’s some anecdotal information largely related to front-line organizations.
For example, the Association for Healthcare Philanthropy in promos for its webinars reports:
- “email appeals generating hundreds of thousands of dollars witih an average gift of around $250”
- “60-70% of donations from first-time donors”
- “email click-thru-rate increases of 300%.
Over on the consulting side the RKD Group reports “Record-Breaking Online Donations” and indicating that “for 15 of our food bank clients, online donations totaled more than $10.3 million from March 12 to March 31. During that same time period in 2019, online donations only totaled $803,453. That’s a 1,187% increase.”
You can see specific organization results for groups like the Food Bank for New York City, some state (Utah, Connecticut) food banks and Brigham and Women’s Hospital in Massachusetts by going to RKD’s blog .
On the non-front-line organization (culture, arts, advocacy, education, etc.) the anecdotal reports are mixed. By and large open and click-thru rates are up and returns for those groups using messages that are most relevant to their mission seem to be doing as well or a bit better than before the pandemic. When we have more specific data, we’ll post on that.
For now, and for examples check out the NextAfter Resource Center AND please don’t hesitate to share whatever information you have with us.
Thank you.
Roger
Behavioral Science Q & A
Thanks so much for raising this. Yes, capturing donor information can be helpful for stewardship like newsletters, thank-you letters, impact updates. But how you ask matters. Forcing full data capture introduces friction that can significantly depress conversion, many donors may simply abandon the process. Beyond the friction itself, required fields also shift the emotional experience […]
Read Full Answer
Unlike holidays that everyone already knows, Giving Tuesday is a created event. Many donors recognize the name but not the exact timing, so referencing it becomes a helpful cue. It serves as a reminder and taps into social norm activation (“everyone’s giving today”), which boosts response. However, we still want it paired with the mission, […]
Read Full Answer
When a subject line leads with the match (“Your gift matched!”), it risks triggering market-norm thinking: the sense that giving is a financial transaction rather than an act rooted in values, identity, and care. This shift reduces intrinsic motivation and, over time, can weaken donor satisfaction and long-term engagement. It also makes the email indistinguishable […]
Read Full Answer
There’s no evidence that QR codes suppress mid-value giving; all available research suggests they either help or have no negative effect. In fact, behavioral and usability research consistently shows the opposite: reducing friction at any point in the donation process increases completion rates and total response. And that has nothing to do with capacity and […]
Read Full Answer
What you’re experiencing is very common. Resistance often isn’t about capability, but about motivation quality. If board members feel pushed into fundraising, that triggers controlled motivation (low quality motivation) i.e. obligation, guilt, or fear of judgment, which often results in avoidance. Instead, we need to create conditions for volitional motivation (high quality motivation) by satisfying […]
Read Full Answer
That’s a really thoughtful question, and you’re not the first to raise it. Many of our clients have been cautious about placing the ask at the very end. To address their concern, we’ve tested both approaches, and the results are clear: when the ask comes last, even if that means it appears on the second […]
Read Full Answer