Are You a Normal Distribution Thinker in A Power World?
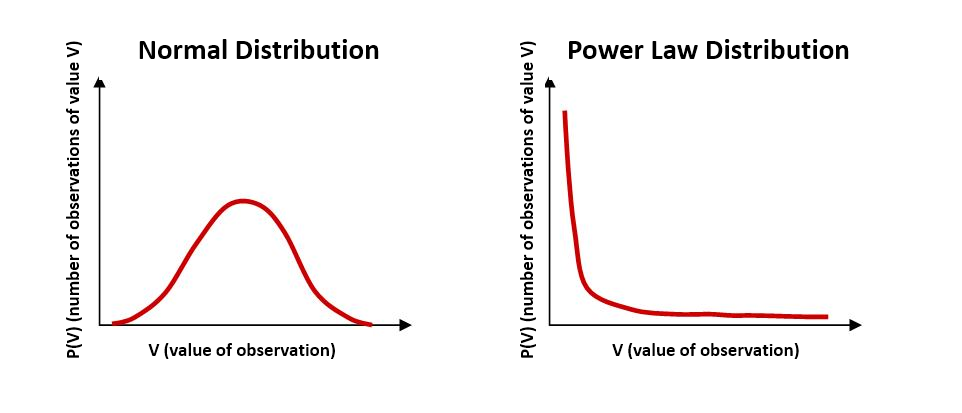
We report average gift as gospel. And if the giving by your donors looks like the normal, bell curve on the left then average and standard deviation (how tall or wide is the middle part) will have told you all you need to know. This world view assumes the outliers are distraction. How many times have you or your agency removed the “outlier” gifts to report the average gift?
Human height, blood pressure, intelligence and a lot of randomness tend to look Normal, the curve on the left. The curve on the right, a power curve, describes the frequency of word use, size of human settlements, the distribution of internet traffic, any system with “power” users and the intensity of earthquakes.
In a power world reporting the average is useless, telling you nothing about what’s really going on. In this world you’ve got two interesting dynamics, the long tail and the highly skewed action at the other end. Your 80/20 rule, Pareto.
How much of your world is a power world? You likely get most of your dollars from a small number of donors. Your gift frequency per donor/per year is highly skewed and follows a power curve. Flip the power curve below and it matches your return from solicitation volume. Big gains going from 0 solicitations to 1, and 1 to 2 and 2 to 4 but hardly any going from 24 to 25 to 50. 
Here’s the challenge. Most of our systems and process and organizational culture is geared towards the Normal distribution world on the left. We treat all donors the same, which means we think there is an average donor and we build our test and control world around this non-existent, average donor.
Living in the Normal world is where efficiency and incremental gain live. The aim of business is to try and build scalable operations through standardized process and design to serve “average customers”. We force this Normal Distribution thinking with our hierarchical org charts, division of labor, cost accounting, etc.
Here’s the thing, it’s really, really hard to move the average; average gift, average output, average cultural competence. And here’s the really big thing, it’s a lot of wasted time and effort trying to move the middle if the world you’re operating in is a Power World.
In a Power World the ‘extremes’ make a really big difference in outcomes. The simple example is the single, $10,000 gift to your appeal. Rather than treat this as anomaly or outlier, what if your time and energy is spent studying this?
In a power world things are more interconnected. And doesn’t your world feel more interconnected? Your supply chain, the geographic spread of your labor pool?
Here is the best part. In a power world the cause tends to be a single, generative idea. This is what some call scale-free theory or deep simplicity.
What the hell does that mean?
- In a normal curve world you process dots. In a power world we look for patterns. If you focus on campaign level versus lifetime value you are likely forcing a normal curve on a power world.
- In a normal world we examine the offer, the creative and the message in a vacuum. We think the March appeal cause of success and failure is isolated from April results.
- In a power world, the thing that caused success and failure is mostly the same (for a given context).
- That means, for example, unearthing why people do what they do and how it differs by who the person is scale-free theory. It’s got exponential and interconnected impact if you apply it across your entire program.
In a power world all the cool stuff with a chance to fundamentally change your program is happening outside convention.
Kevin


