Dewey Defeats Truman!
Conventional wisdom and a veteran political analyst who had predicted the winner in four of the five prior presidentials leading up to this 1948 election were clear; not only would Dewey win but Republicans would retain control of the House and Senate. Dewey of course lost and the Democrats won control of both chambers.
What went wrong? Some of the same things that went wrong in 2016 and 2020 polling. The polls of 1940 – 1948 all underestimated the percentage of the actual vote comprised by Republicans – i.e. sampling error with too many Democrats included in the poll prediction. Those prior years they weren’t more right, they were more lucky and things really came home to roost in 1948.
Fast forward to more modern times. We’re now overwhelmed with state and national polls every election season. And more isn’t always better. The number of state polls conducted between September and the end of October 2020 in Wisconsin, Pennsylvania, Arizona and Michigan nearly doubled from 2016. But, if the error is correlated in the same direction (it was in all but Arizona) then you make matters worse with the illusion of greater precision and mistaking it for accuracy (i.e. non-bias).
The post-mortem coming out of 2016 and the large, important misses in the midwestern states (i.e. Wisconsin, Michigan, Pennsylvania) was, once-again, sampling error; this time too many high, formal, education (college grad or higher) folks included, which of course missed a big part of the Trump vote. All the pollsters heading into 2020 got this message and weighted their sample on education level (among other factors).
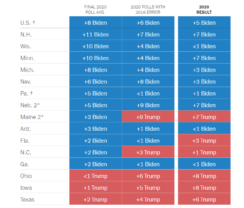
So, what happened in 2020? In every swing state but Arizona, Trump wildly outperformed the polling average from one of the more popular (and outspoken) polling aggregator sites, FiveThirtyEight (538); Trump was +7 (over 538 prediction) in Ohio, +8 in Wisconsin, +6 in Florida.
Before Biden supporters tune out with a “who cares, we won” take on all this, know there is some evidence that all these polls don’t just predict behavior, they influence it. Namely, decreasing the likelihood – even a bit – of people bothering to vote and this effect can happen for the predicted winner (e.g. Clinton vote ‘suppression’ in 2016 – she even claimed as much) and losing candidate (e.g. Trump in 2020).
And contrary to some opinion makers on both sides, there is no systematic bias in favor of D’s or Rs in political polling overall. The state polls miss a lot in both directions and those get rolled up into the aggregator forecasts.
So, again, what went wrong this time? Well, first off, the New York Times was prescient in creating this chart (before Election Day) showing what would happen if the 2020 polls were as wrong as the 2016 polls. Turns out they were and in almost exactly the same ways; albeit not the same reason in that all the 2020 polling did correct for under-representing less (formally) educated voters.
And the national polls were even worse than four years ago. This high correlation of error in 16 and 20′ despite correcting for 16′ errors suggests there is a deeper, fundamental measurement problem of the attitudes of this part of the electorate (i.e. those who voted for Trump in 16′ and 20′) and not just the share of the electorate. Said differently, the survey data got worse over the last four years canceling out the (superficial) changes pollsters made to address what went wrong in 2016.
College education is merely a proxy for vote preference and as we’ve written before, demographics are easy to collect or buy and easy to report on and mentally process but rarely are they causal or illuminating. Reducing voter intent and preference to a horse race question and weighting by a few demographics seems to leave lots of room for error.
For example, it may be useful (necessary even) to start getting more refined measures of who voters. For example, there are,
- Measures of trust that may correlate with ideology and intention or
- Identity and salience of that Identity (how strongly do I identify as a Libertarian or Democrat or Conservative)
- Personality (we know Agreeable people skew towards Liberal and Conscientious towards Conservative)
- Moral Frame – we know that certain people view moral decisions (of which voting can certainly be included) on the basis of fairness/equity (Liberals disproportionately) while others use a loyalty/authority lens (Conservatives disproportionately).
The point isn’t for any of these measures, in isolation to replace the horse race question but rather, augment it, via modeling. It may well be that the best way to measure candidate preference is to stop treating the ubiquitous horse race survey question as the “answer” in polls.
And what about the forecast prognosticators that build fancy models incorporating all these state and national polls? Well, these firms like 538 add in other ‘fundamentals’ (e.g. economic data and candidate favorability data) to make their probabilistic forecasts (e.g. Biden has 84% chance of winning Electoral College) more accurate.
However, what these firms also build into their models is big, hairy error terms. These error terms are there, in part, to account for the “known unknowns” problems with state polling. But, these error terms being added in are, at best, guesses. More accurately, they are subjective whims that try to add known uncertainty about election outcomes lest they live with a model that seems too good to be true – e.g. Biden has a 95% of winning. Replacing these error terms with better data is always a good idea and these deeper, more causal, psychological factors might help.
So, what did go wrong? It’s, frankly, too soon to tell with any degree of specificity and certainty. What seems to be clear is that the old adage of garbage in and garbage out rules the day, whether its 1948 or seventy years later.
Kevin
4 responses to “Dewey Defeats Truman!”
Behavioral Science Q & A
Thanks so much for raising this. Yes, capturing donor information can be helpful for stewardship like newsletters, thank-you letters, impact updates. But how you ask matters. Forcing full data capture introduces friction that can significantly depress conversion, many donors may simply abandon the process. Beyond the friction itself, required fields also shift the emotional experience […]
Read Full Answer
Unlike holidays that everyone already knows, Giving Tuesday is a created event. Many donors recognize the name but not the exact timing, so referencing it becomes a helpful cue. It serves as a reminder and taps into social norm activation (“everyone’s giving today”), which boosts response. However, we still want it paired with the mission, […]
Read Full Answer
When a subject line leads with the match (“Your gift matched!”), it risks triggering market-norm thinking: the sense that giving is a financial transaction rather than an act rooted in values, identity, and care. This shift reduces intrinsic motivation and, over time, can weaken donor satisfaction and long-term engagement. It also makes the email indistinguishable […]
Read Full Answer
There’s no evidence that QR codes suppress mid-value giving; all available research suggests they either help or have no negative effect. In fact, behavioral and usability research consistently shows the opposite: reducing friction at any point in the donation process increases completion rates and total response. And that has nothing to do with capacity and […]
Read Full Answer
What you’re experiencing is very common. Resistance often isn’t about capability, but about motivation quality. If board members feel pushed into fundraising, that triggers controlled motivation (low quality motivation) i.e. obligation, guilt, or fear of judgment, which often results in avoidance. Instead, we need to create conditions for volitional motivation (high quality motivation) by satisfying […]
Read Full Answer
That’s a really thoughtful question, and you’re not the first to raise it. Many of our clients have been cautious about placing the ask at the very end. To address their concern, we’ve tested both approaches, and the results are clear: when the ask comes last, even if that means it appears on the second […]
Read Full Answer
One of the podcasts I listened to recently (https://www.wnycstudios.org/podcasts/otm/segments/forecasts-didnt-help-us) discussed the inability to successfully model the poll sample as there are very few events that go into it, Presidential races only happen every 4 fours and there are so many external variables (Social Media, Jim Comey), unlike weather modelers who can check their models every day. Zeynep Tufekci, associate professor at University of North Caroline, Chapel Hill. And as you mentioned above, the released poll data itself influences voter behavior.
I’m not so quick to dismiss the idea that pollsters are biased. Pollsters contracted by the mainstream media have an incentive to ensure their results support the ongoing media narrative. Furthermore, we’ve seen how big tech companies (e.g., Twitter, Facebook, and Google) have exhibited political bias that conforms with the philosophies/interests of their owners. So, why would we automatically expect that things would be different among polling companies? Also, I suspect that pollsters, like many others, feel some sense of peer pressure and might be uncomfortable producing a poll with results that would be an outlier. Herd-mentality is a powerful force. While I’m not asserting that all, or even some, pollsters are biased, I’m also not willing to accept it on faith that they are unbiased. Not only does polling influence whether people vote, it influences who people vote for and even who they contribute to. The issue of pollster bias deserves to be examined rather than simply dismissed.
I also want to mention that I believe, and have for years, that the mainstream media focuses entirely too much on polls. The media covers elections as if they’re horse races. I believe the public would be far better served if the media focused more on the issues as well as the experience and character of the candidates. If the media did that, the public would be better informed and might even be more inspired to vote even when there’s not an election-year dynamic rising to the level of Trump vs. Biden. In my opinion, there are too many polls and too many news stories about polls. Better balance in news coverage is needed.
They use polls to sell ads. They really odn’t inform. But polls are easy. real journailsm is expensive. Here ‘s an interesting piece I just found on Nate Silver and FiveThirtyEight. “The Grifters” FWIW https://www.epsilontheory.com/the-grifters-chapter-3-election-prediction/
Harvey, thanks for the link. I could write posts for weeks about the forecasting done by 538 and others and there are some very good (and entertaining) points in the link you shared. One of my bigger issues with 538 and the other aggregators is that their model is not just rolled up polls, it includes other factors (often called “foundational”) like economic statistics and candidate favorability precisely because they know there is error in the state (and national polling) that goes beyond the ridiculously misleading margin of error.
In other words, their models are supposed to correct for polling error, not amplify it. And in fact, they do try to correct for it. However, my issue is that it’s done in a very haphazard way – namely to throw in other predictors (economic data) plus error terms. What the hell are error terms? That is subjective, guesswork on how wrong everything in the model still might be. These random error terms create all sorts of odd, noise. For example, 538 models (under the hood) showed a negative correlation with Trump winning California and then winning New Jersey. If Trump won California it would signify a massive tidal wave of Trump support that would wash over damn near every state, including New Jersey. That’s what happens when your error terms are just random tweaking to try to get to an outcome (i.e. final probability) that “feels” right.
Hence my comments in the post about measuring different, better, more nuanced factors from the voters, not just the (crappy) horse race question.