Attribution Gone Wild: How $100 Becomes $400
Picture this: A mid-size nonprofit spends $783K across channels and raises $3.1M. Pretty straightforward, right? But here’s where it gets interesting – and by interesting, I mean messy.
Let’s look at what each channel claimed versus what actually happened:
Take a moment with those numbers. The platforms are claiming $7.27M in revenue from activities that actually generated $3.1M. That's not a rounding error – it's someone thinking the pie is twice as big if make 8 slices instead of 4.
Why the massive gap? It's not because platforms are deliberately lying (well, mostly). It's because they're all claiming credit for the same donations. It's like every player on a basketball team claiming they scored all 100 points because they touched the ball during each play.
Here's a simple illustration.
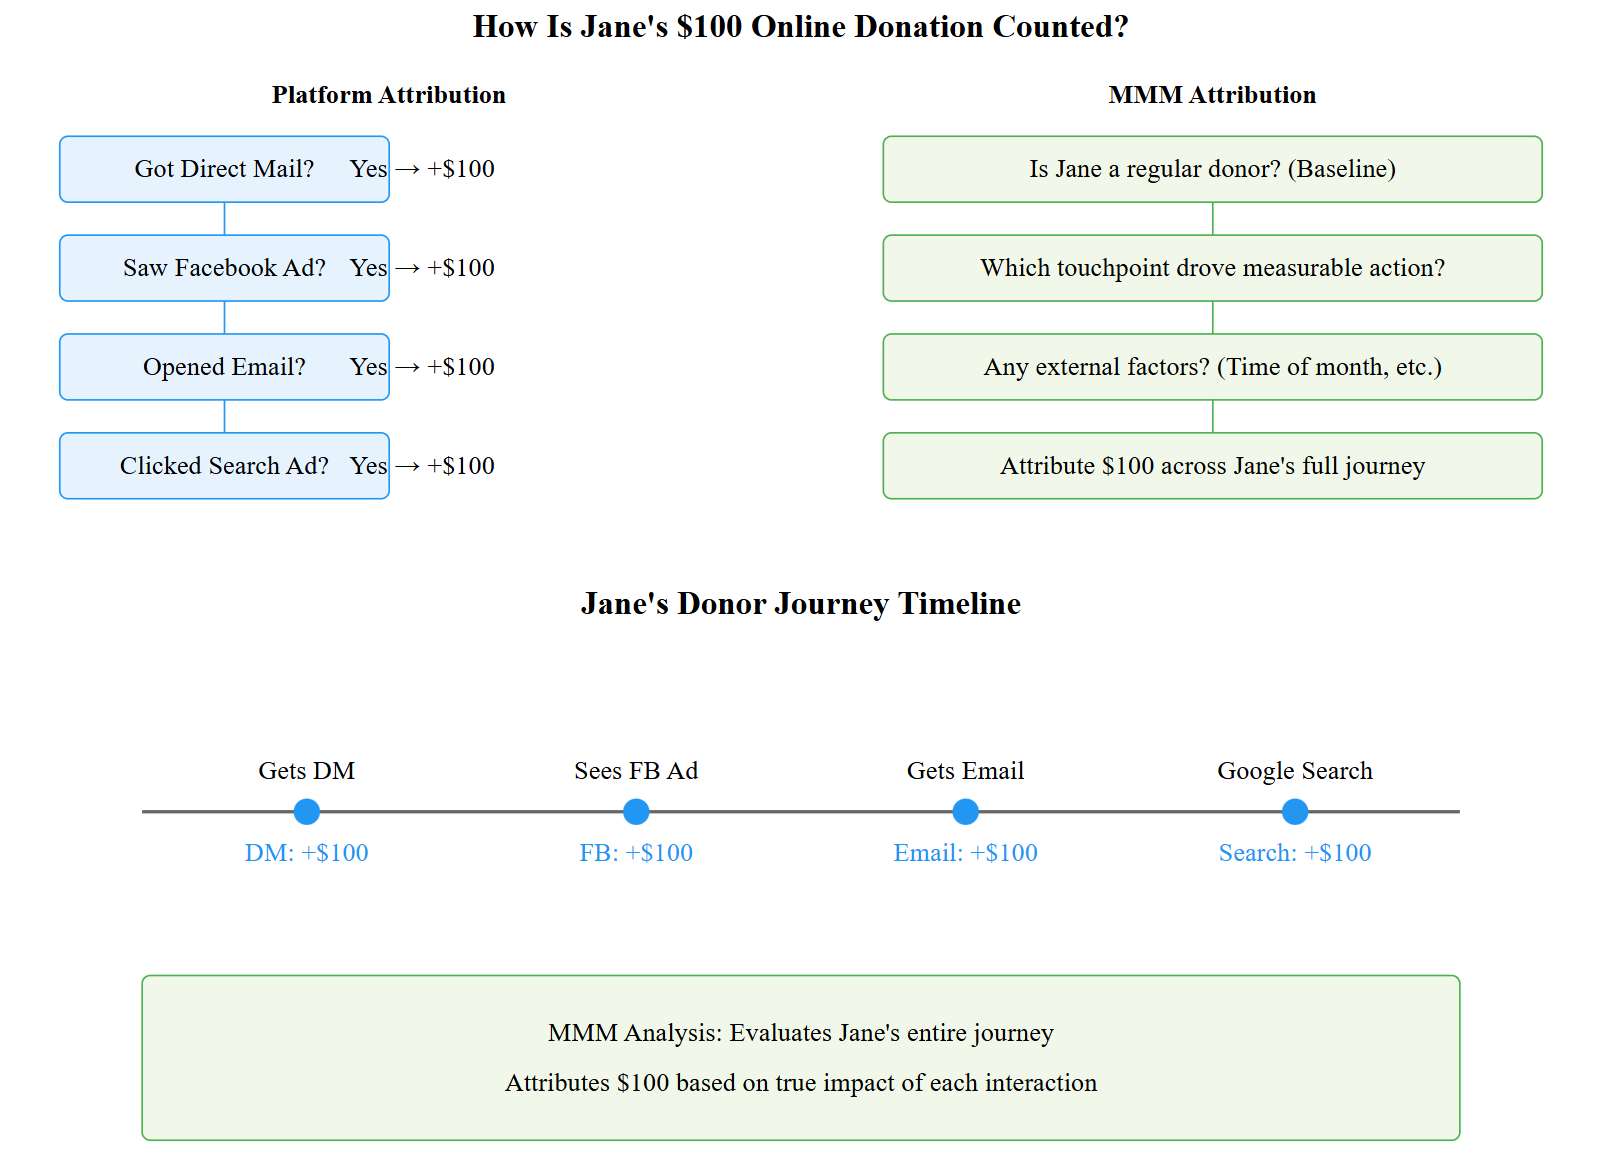
1. Jane Donor gets your direct mail piece
2. Sees your Facebook ad
3. Gets your email
4. Googles your organization
5. Makes a $100 donation
Now watch the magic:
- Direct mail claims it (matchback analysis!)
- Facebook says "we influenced that!" (view-through conversion!)
- Email takes credit (last touch!)
- Google Search says "they clicked our ad!" (last click!)
Suddenly, your $100 donation becomes $400 in channel reporting. The problem this creates isn't the revenue side or even reporting, it's the spending side.
ROAS should, in theory, be your guiding star. But when every channel inflates its impact are you going to argue to increase spend in paid search, mail, email and ads? The person in charge of each channel surely will.
The key takeaway is this: before asking for more money, fix the current budget by shifting when spend (too much in 4th quarter likely) and where (channel). This will ruffle some silo feathers but the upside is everyone's starting from a flawed baseline. The goal isn’t perfection; it’s progress—because when everyone's wrong, nobody needs to defend their turf, we're just trying to be less wrong together.
The solution isn't to stop measuring channel performance. It's to think and do differently. Here's suggestions going from easier to harder (but doable for any charity - use GPT as your analyst).
Overall Revenue - Ignore Channel
- Total Revenue
- This month vs. last month
- This month vs. same month last year
- Year-to-date vs. last year
- Growth Score -
- New donors minus lost donors
- Shown as % of donor file
- Repeat for Revenue
- Total Cost to Raise a Dollar
- ALL costs (staff, agency, media, etc.)
- Divided by total revenue
- Track monthly
Incrementality Testing - i.e. Did Generate Extra Money or Not? (An Example)
- Turn something off, see total rev impact
- Change spend for Channel X for period (up or down), see change in total rev
- Geo-Test
- Take two similar markets: Portland, ME and Manchester, NH, both typically raise about $100K per month online
- Run Facebook ads only in Portland for 3 months ($15K spend)
- Portland raises $120K/month during test
- Manchester stays at $100K/month
- The "extra" money is $20K/month (not $120K Facebook will claim)
- Real ROAS is 1.33 ($20K divided by $15K), not 8.0 that Facebook reports
Poor Man's MMM (Excel Version)
Data:
- Column A: Dates (Months)
- Column B: Revenue (in dollars)
- Column C: Mail spend (in dollars)
- Column D: Digital ad spend (in dollars)
- Column E: Interaction term (TV spend × Digital spend, Formula: C*D)
- Column F: Log-transformed Mail spend (to account for diminishing returns, Formula: LN (C) )
- Column G: Log-transformed Digital spend (to account for diminishing returns, Formula LN (D)
Regression Formula:
- In a cell, enter:
Where:
B2:B13: Sales data (dependent variable).E2:G13: Transformed mail spend, transformed Digital spend, and interaction term (independent variables).TRUE: Includes the intercept (baseline revenue).TRUE: Outputs additional regression statistics.
Interpret Output:
- The Log numbers - e.g., if Log value for mail is 862.89 you get an extra $862.29 for every 1% increase in mail spend, holding everything else constant.
- Interaction Term number - e.g., -0.027 is the cross-channel effect between mail and Digital spend. The negative coefficient suggests a slight cannibalization effect, meaning higher spend in both channels simultaneously could reduce incremental effectiveness.
- Intercept - e.g. -36,379.12. This is wonky in a regression, can ignore unless are using the regression formula for what-if scenarios on changes in spend, in which case, use it as is.
Kevin


Ridiculously insightful … and chuckle-to-laugh-aloud entertaining. Thank you. I’ve forgotten what ROAS means, but I’ll look it up.
Hi Tom. the “A” for ad is a bit of a misnomer, really any mkt/fundraising thing we spend money on – mail, telefundraising, etc.