Save the Pie for Dessert
It’s July 2nd, which means 85% of your American colleagues are “working remotely,” which in practice means their laptops are open while they argue about who forgot to buy charcoal.
So it feels like the perfect week to talk about something equally overused and underperforming: pie charts.
You know, those colorful disks everyone loves to slap into PowerPoint, convinced they’re communicating insight when all they’re really doing is communicating “I didn’t think very hard about this.”
Here’s why pie charts suck:
-
Humans are terrible at comparing angles.
You think you can eyeball which slice is bigger when the numbers are close? You can’t. -
They collapse when you have more than a few categories.
Five slices? Now it’s a rainbow pizza of confusion. -
They tempt people to use them for non-categorical data.
Nothing says “data amateur hour” like showing ordered, structured data in a pie. - They distract you with decoration instead of clarity.
“Save the pies for dessert.”
Here’s an example.
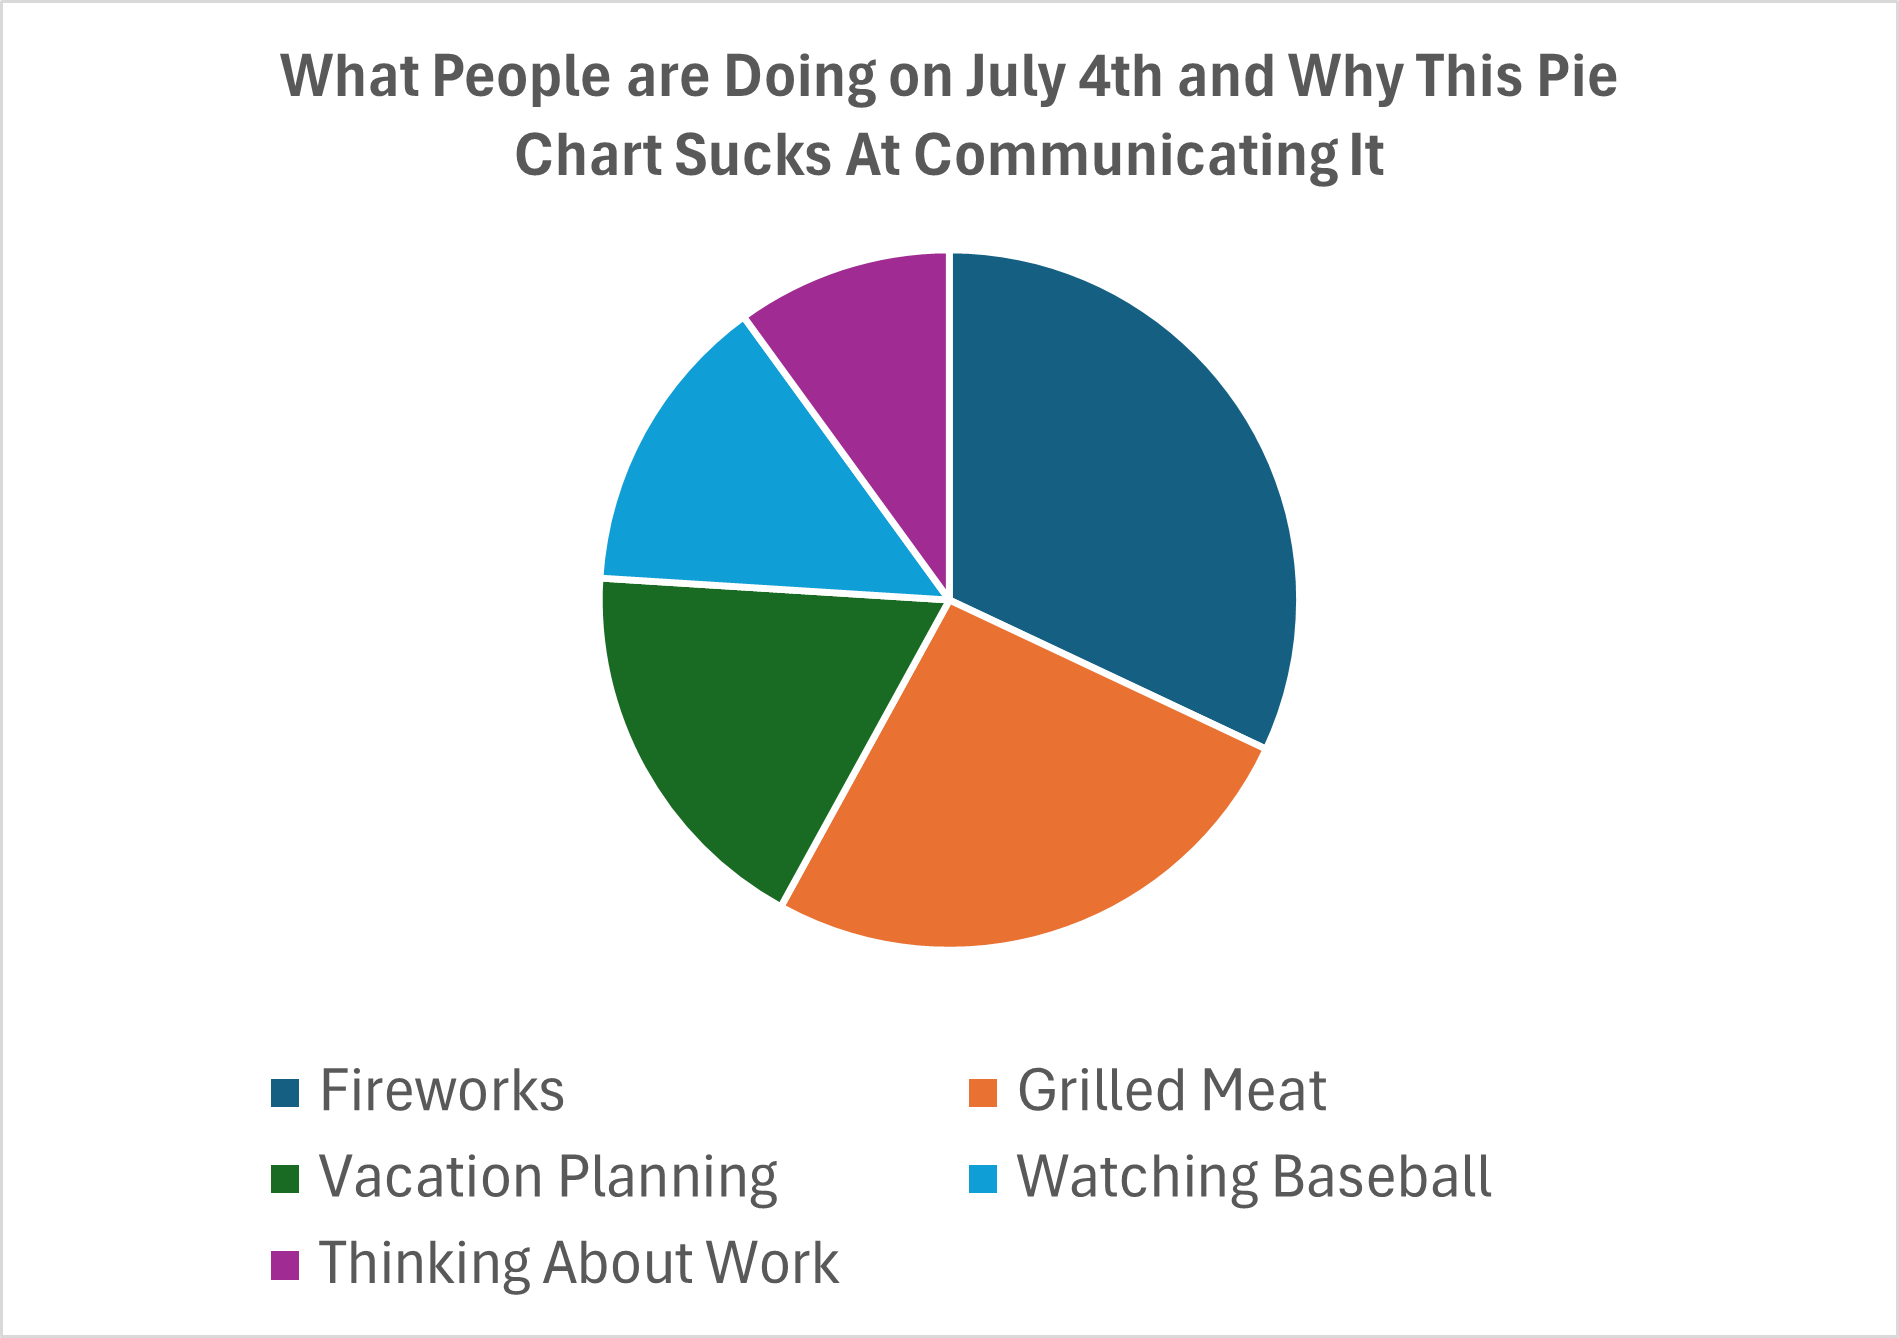
- Can you tell at a glance whether Grilled Meat is bigger or smaller than Fireworks? (Answer: You’d have to squint or read labels—whereas a bar chart would show it instantly.)
- Is Vacation Planning twice as popular as Thinking About Work? Or only about 50% bigger?(Answer: Good luck figuring that out without the exact numbers.)
- How much bigger is Watching Baseball than Thinking About Work? (Answer: Your eyes can’t judge that angle precisely.)
- If I showed you this same chart again next week with the slices slightly shifted, would you notice any change at all? (Answer: Probably not—because pie charts are terrible for seeing trends over time.)
Yet people keep reaching for pies because they look friendly and familiar but just because it’s familiar doesn’t mean it’s good.
The same could be said about many 4th of July side dishes. So this week, while everyone is half-checked-out anyway, do yourself a favor: Delete the pie chart.
Save them for dessert.
Kevin
Behavioral Science Q & A
Thanks so much for raising this. Yes, capturing donor information can be helpful for stewardship like newsletters, thank-you letters, impact updates. But how you ask matters. Forcing full data capture introduces friction that can significantly depress conversion, many donors may simply abandon the process. Beyond the friction itself, required fields also shift the emotional experience […]
Read Full Answer
Unlike holidays that everyone already knows, Giving Tuesday is a created event. Many donors recognize the name but not the exact timing, so referencing it becomes a helpful cue. It serves as a reminder and taps into social norm activation (“everyone’s giving today”), which boosts response. However, we still want it paired with the mission, […]
Read Full Answer
When a subject line leads with the match (“Your gift matched!”), it risks triggering market-norm thinking: the sense that giving is a financial transaction rather than an act rooted in values, identity, and care. This shift reduces intrinsic motivation and, over time, can weaken donor satisfaction and long-term engagement. It also makes the email indistinguishable […]
Read Full Answer
There’s no evidence that QR codes suppress mid-value giving; all available research suggests they either help or have no negative effect. In fact, behavioral and usability research consistently shows the opposite: reducing friction at any point in the donation process increases completion rates and total response. And that has nothing to do with capacity and […]
Read Full Answer
What you’re experiencing is very common. Resistance often isn’t about capability, but about motivation quality. If board members feel pushed into fundraising, that triggers controlled motivation (low quality motivation) i.e. obligation, guilt, or fear of judgment, which often results in avoidance. Instead, we need to create conditions for volitional motivation (high quality motivation) by satisfying […]
Read Full Answer
That’s a really thoughtful question, and you’re not the first to raise it. Many of our clients have been cautious about placing the ask at the very end. To address their concern, we’ve tested both approaches, and the results are clear: when the ask comes last, even if that means it appears on the second […]
Read Full Answer