All Segmented Up and Nowhere to Go
Why create segments? The only reason is you believe Different Strokes was something other than an early 80s sitcom.
But what makes people different isn’t the question. Some people like red hats, others blue; knowing that won’t help you raise more money.
What are the different reasons people support your charity is closer to the mark.
Consider this very expensive segmentation by a well-known agency for a well-known charity brand.
Forget the math and science of it for the moment. The first thing that jumps off the page to me is 10 segments with names that tell me exactly zero about who they are and their different reasons for supporting the organization.
At bare minimum this segmentation fails on the simple labeling task alone – namely wanting those segment names to be descriptive of who they are and their reason for support. It’s like naming fruits by color (not counting Oranges).
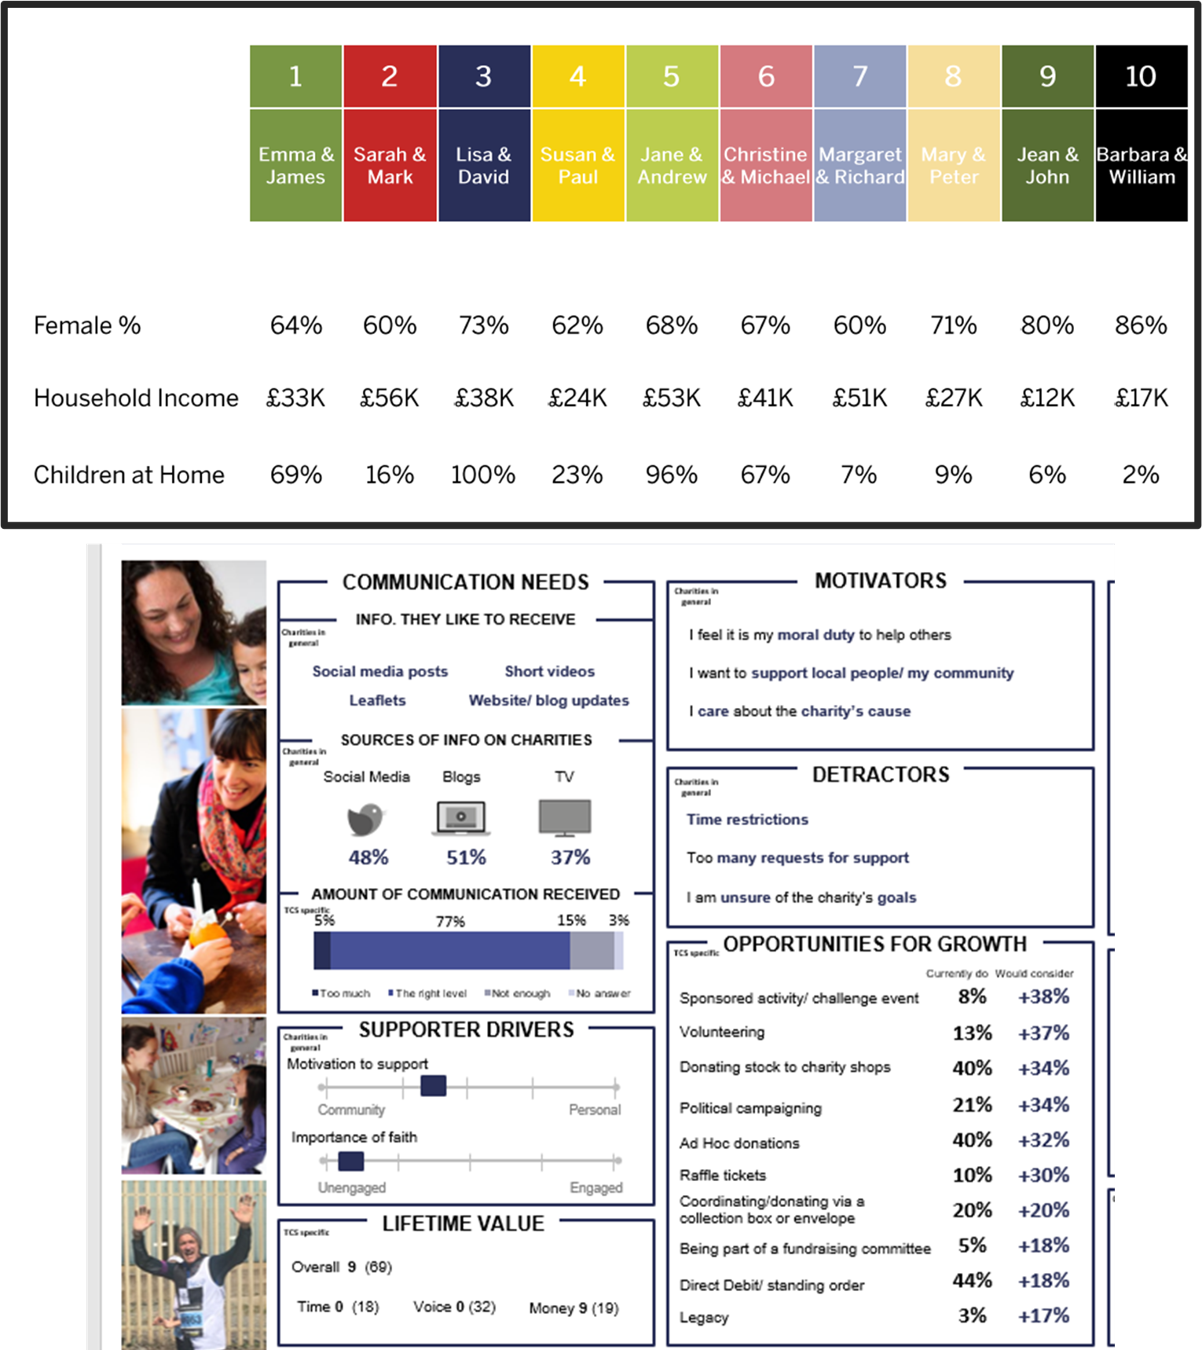
Now let’s dig in a bit more. The rich, detailed descriptors for each segment, as illustrated for one of the segments, are deceptively interesting. Heck, there is a section called “Motivators”. What the fuller report shows is that these lovely charts show 10 groups that are more similar than different on these supposed insights, thus violating segmentation 101.
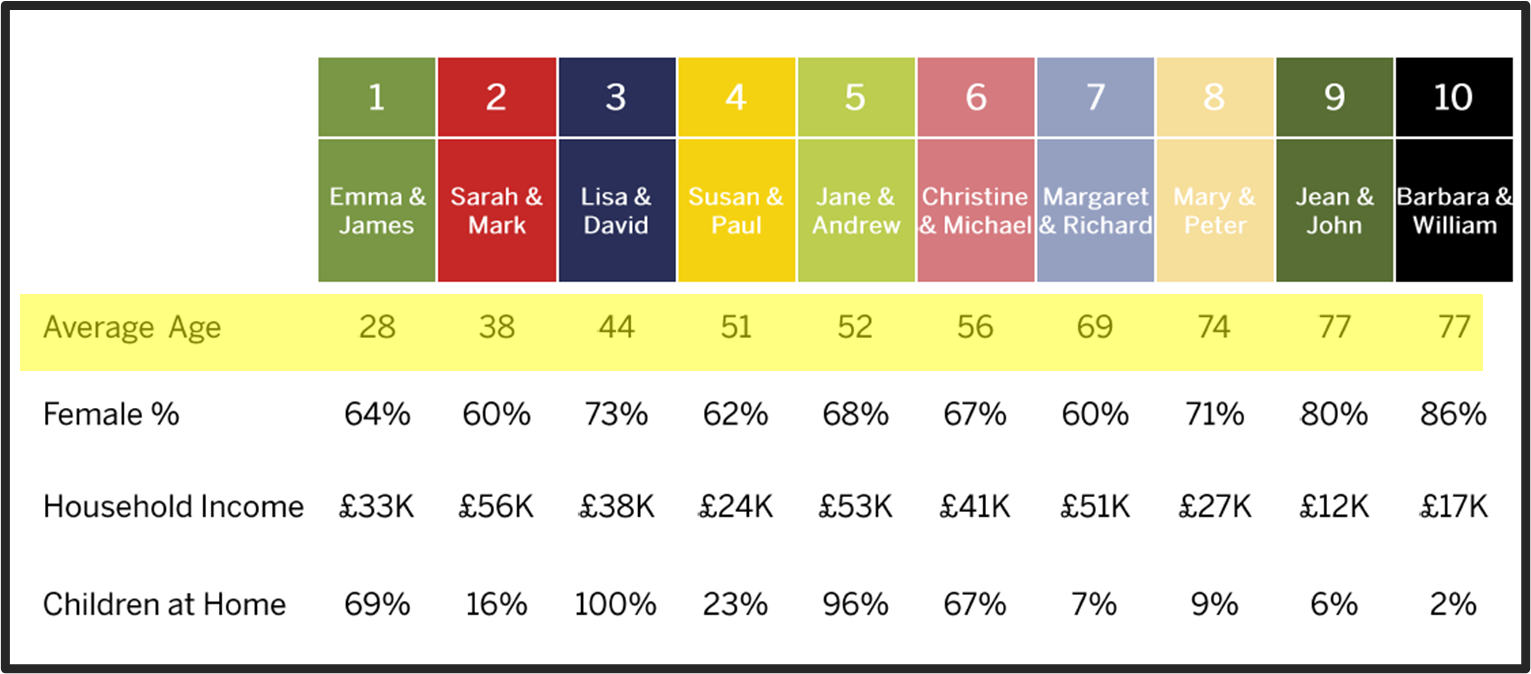
The death knell for this segmentation having any value is what I obscured in the first row but show now. Notice anything about the average age and it’s relationship to the segments?
It’s perfectly linear. This really expensive segmentation with statistical clustering and enough PowerPoint slides to wallpaper a room is the equivalent of an age append. Age, as one of the variables in the segmentation stew, is driving the entire outcome.
There are technical and logical reasons for this but suffice to say if you think age helps explain why people give (it doesn’t) then you could have done this segmentation scheme for pennies on the dollar.
The hidden pony in this pile of manure is buried in one of the 6,231 PowerPoint slides.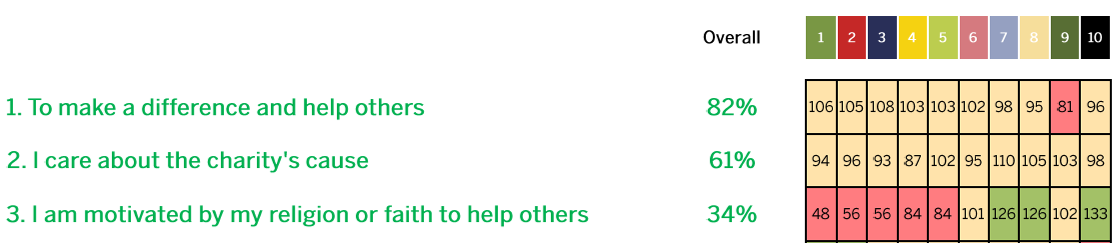
This shows the top 3 reasons people cited for their reason for giving to this charity. The first two showcase the problem with asking an open-ended survey question asking people to introspect and come up with their innate, detailed reason they give.
Most people aren’t willing or able to do that mental work and take a shortcut with generic answers. As evidence, 8 out of 10 gave the generic “to make a difference” response and on the right, you see this answer cut across all 10 segments pretty evenly with the Index score hovering around 100 for all but 1 group.
I don’t doubt the people who gave answer one or two, it’s just too superficial to do anything with it and as important, whatever I would do with it, I’d be doing for everybody since all the segments said the same thing.
Answer three is the pony. This is getting closer to an innate, Identity answer. And one that I can operationalize and one that is very different across these (useless) age cohorts.
Tailoring an appeal to religious reasons for giving and only sending it to groups 7,8 and 10 makes some sense. This is one-hand behind my back, being forced to use these silly age buckets.
The better alternative is Identity based research to unearth these different motivators. And not relying on open-ended survey data but more structured survey questions that people can reliably answer and that give us the ‘why’ insight we need.
Then I can use 3rd party data (demos, lifestyle) as proxy to score up the file with Identity based segments. Religious people, Parents (it’s a kid charity), etc.
Turn the thing on its head. Start with their different reasons for supporting as your strategic foundational insights. Then use otherwise useless, messy, noisy demos and lifestyle data to reverse engineer and score the file to achieve scale.
Kevin
3 responses to “All Segmented Up and Nowhere to Go”
Behavioral Science Q & A
Thanks so much for raising this. Yes, capturing donor information can be helpful for stewardship like newsletters, thank-you letters, impact updates. But how you ask matters. Forcing full data capture introduces friction that can significantly depress conversion, many donors may simply abandon the process. Beyond the friction itself, required fields also shift the emotional experience […]
Read Full Answer
Unlike holidays that everyone already knows, Giving Tuesday is a created event. Many donors recognize the name but not the exact timing, so referencing it becomes a helpful cue. It serves as a reminder and taps into social norm activation (“everyone’s giving today”), which boosts response. However, we still want it paired with the mission, […]
Read Full Answer
When a subject line leads with the match (“Your gift matched!”), it risks triggering market-norm thinking: the sense that giving is a financial transaction rather than an act rooted in values, identity, and care. This shift reduces intrinsic motivation and, over time, can weaken donor satisfaction and long-term engagement. It also makes the email indistinguishable […]
Read Full Answer
There’s no evidence that QR codes suppress mid-value giving; all available research suggests they either help or have no negative effect. In fact, behavioral and usability research consistently shows the opposite: reducing friction at any point in the donation process increases completion rates and total response. And that has nothing to do with capacity and […]
Read Full Answer
What you’re experiencing is very common. Resistance often isn’t about capability, but about motivation quality. If board members feel pushed into fundraising, that triggers controlled motivation (low quality motivation) i.e. obligation, guilt, or fear of judgment, which often results in avoidance. Instead, we need to create conditions for volitional motivation (high quality motivation) by satisfying […]
Read Full Answer
That’s a really thoughtful question, and you’re not the first to raise it. Many of our clients have been cautious about placing the ask at the very end. To address their concern, we’ve tested both approaches, and the results are clear: when the ask comes last, even if that means it appears on the second […]
Read Full Answer
“The hidden pony in this pile of manure is buried in one of the 6,231 PowerPoint slides.” Bless your shoveling, Kevin!
Thanks for this one, Kevin. So true – our industry often seems more in love with useless data (and charts) than with actual, purposeful answers. Thanks for reminding us it’s about the pony!
regarding ” The better alternative is Identity based research to unearth these different motivators. And not relying on open-ended survey data but more structured survey questions that people can reliably answer and that give us the ‘why’ insight we need.”
Please share some good survey questions with us.