How Other People Lie With Data
Not you, of course. You are a moral upright person who wants to paint only the most accurate possible pictures of where you are and where you are going.
With the knowledge of statistics comes the responsibility of presenting them effectively. My first nonprofit boss used to say that if you interrogate the data, it will confess. I would submit a corollary: if you torture the data, it will start confessing to stuff just to make you stop.
So here are some common tricks people will use to make their points. Arm yourself against this, less you be the victim of data presented with either malice or ignorance.
The wonky y-axis
The person presenting to you was supposed to increase revenue by a lot. In fact, the person increased it by only a little. The weasel solution? Make a mountain out of that molehill:
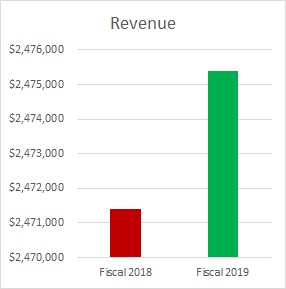
Note that the difference between the top and bottom of the y-axis is only $6,000. Here’s what that same graph looks like with the y-axis starting at 0, as we are trained to expect unless there’s a very good reason:
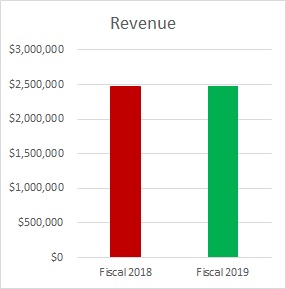
Both are true, but the latter is a more accurate representation of what went on over the year.
Ignoring reference points
Let’s look at that last graph with the budgeted goal added in.
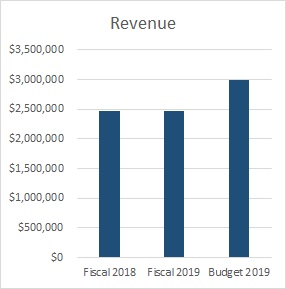
This tells a very different story, no? Always be on the lookout for context like this.
The double wonky y-axis
Here’s a relatively famous example from the debate over Planned Parenthood a few years back:
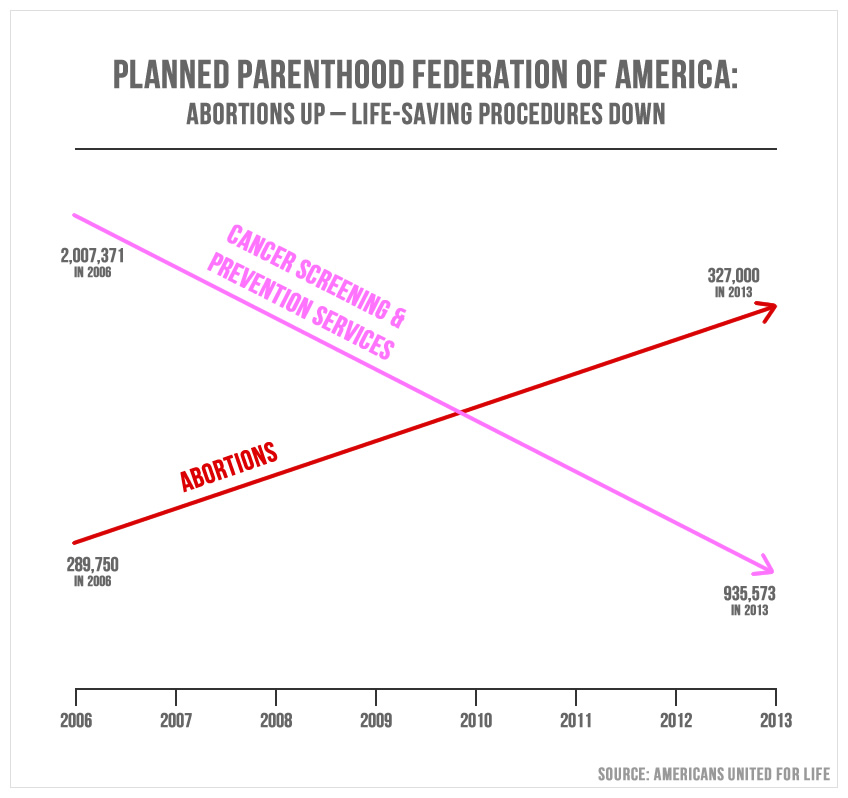
Hat tip to Politifact for the graphic.
The graph seems to say that Planned Parenthood health screenings decreased, abortions increased, and now Planned Parenthood performs more abortions than health screenings.
But this is a case where the graph has two different y-axes. Looking at the data, you can see that there were still well more than double as many prevention services performed as abortions. When we look at the graph, it looks like the opposite is true.
Again, you may choose to do with this information what you will; there are many who would say one abortion is too many. However, to paraphrase Daniel Patrick Moynihan, you can have your own opinions, but not your own facts.
The outliers
This is one of those things that is less frequently used by people to fool you and more often overlooked by people who subsequently fool themselves.
Here’s a sample testing report.
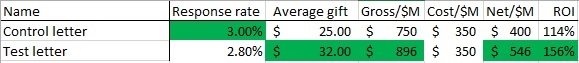
This one seems like a pretty clean win for Team Test Letter. Generally, you are going to take the .2% point decrease in response rate in order to increase average gift by $7 and an additional 14.6 cents per piece mailed out. Game, set, match.
But one must always ask the uber-question: why? So you look at the donations. It turns out a board member mailed her annual $10,000 gift to the test package. No such oddball gifts went to the control package. Since this is not likely a replicable event, let’s take out this one chance donation out and look at the data again.
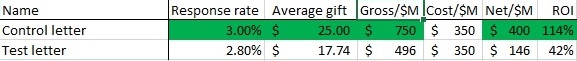
An even cleaner win for Team Control. The test appears to have suppressed both response rate and average gift.
Percentages versus absolutes
I actually saw a variant of this one happen live. Check out the graph below of email open rates, where a new online team came in and the director bragged about the increase in open rates and the great job her team was doing in writing subject lines.
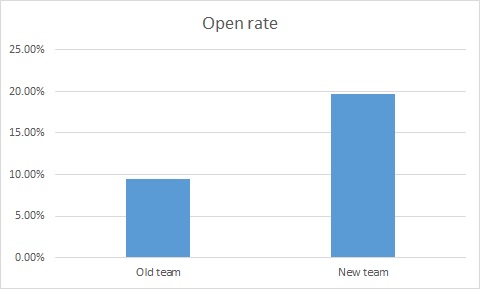
Wow. Clearly, much better subject lines under the new regime, no? More people are getting our messages.
Well, for clarity, let’s look at this on a month by month basis.
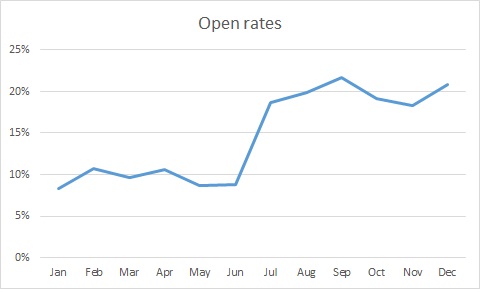
So, something happened in July that spiked open rates. Maybe it’s the new team, but we must ask “why”. One of the common culprits, when you are looking at percentages, is a change in N, the denominator. Let’s look at the same graph, but instead of percentages, we are going to look at the number of people who opened the email.

Huh. Our big spike disappeared.
In looking into this, July is when we started suppressing people who had not opened an email in the past six months. This is actually a very strong practice, preventing people who don’t want to get email from you, have moved on to another address, or were junk data to begin with off your files. As a result, your likelihood of being called spam goes down significantly.
So it’s a good practice to follow… but it doesn’t mean that you have hired a subject-line-writing wizard.
Correlation does not equal causation
FiveThirtyEight ran a piece on how Matt Damon is more attractive in movies where he is perceived as being smarter as The Martian came out (which, considering his role was MacGyver the Space Botanist, was probably perceived as pretty smart).
You can look at this and make a logical conclusion: the smarter a Matt Damon character is in a movie, the more attractive that character is perceived to be. This is plausible even though dreaminess was judged from a still frame – if Matt Damon is wearing an attractive sweater, it’s one of the Bourne movies; if it’s WWII garb, probably Saving Private Ryan.
This conclusion would reason that when Damon plays Neil DeGrasse Tyson in the upcoming biopic, his resultant sexiness will distract more problematic areas of casting.
There’s also the hypothesis posited by the author: “The more attractive Damon is perceived to be in a movie, the smarter he is perceived to be.” This says the reverse of the above: if Damon is attractive in a movie, he will be perceived to be smart. This too is plausible – we tend to overestimate the competence of people we find to be attractive (this is why I don’t go throwing my picture around, lest folks discount my advice).
Or it could be an exogenous third factor that causes both. What if make-up artists want to symbolize dumbness by making actors unattractive (actually, since it’s Matt Damon, let’s say less attractive not unattractive)? Film is, after all, a visual medium and since they know people underestimate less attractive people, they aim to make less competent characters less attractive.
Those are the ways correlation can go: A can cause B, B can cause A, or C can cause A and B.
This is what we must guard against in drawing final conclusions, but rather continually refining our thoughts. Let’s say you are seeing a general trend that your advocacy mail packages are doing better than your average mail package. It’s generally safe to say more advocacy mail packages would be better. But what if it isn’t the advocacy messaging, but that advocacy messages have a compelling reply device? Or that when you mailed your advocacy pieces, you were also in the news?
One of the key parts of determining the results of a test is learning what the test actually means. It’s important to strip away other possibilities until you have determined what the real mechanism is for success or failure.
You don’t have to be versed in all manner of stats; the most important thing is to keep asking “why.” From that, you can find the version closest to the truth.
Nick
2 responses to “How Other People Lie With Data”
Behavioral Science Q & A
Thanks so much for raising this. Yes, capturing donor information can be helpful for stewardship like newsletters, thank-you letters, impact updates. But how you ask matters. Forcing full data capture introduces friction that can significantly depress conversion, many donors may simply abandon the process. Beyond the friction itself, required fields also shift the emotional experience […]
Read Full Answer
Unlike holidays that everyone already knows, Giving Tuesday is a created event. Many donors recognize the name but not the exact timing, so referencing it becomes a helpful cue. It serves as a reminder and taps into social norm activation (“everyone’s giving today”), which boosts response. However, we still want it paired with the mission, […]
Read Full Answer
When a subject line leads with the match (“Your gift matched!”), it risks triggering market-norm thinking: the sense that giving is a financial transaction rather than an act rooted in values, identity, and care. This shift reduces intrinsic motivation and, over time, can weaken donor satisfaction and long-term engagement. It also makes the email indistinguishable […]
Read Full Answer
There’s no evidence that QR codes suppress mid-value giving; all available research suggests they either help or have no negative effect. In fact, behavioral and usability research consistently shows the opposite: reducing friction at any point in the donation process increases completion rates and total response. And that has nothing to do with capacity and […]
Read Full Answer
What you’re experiencing is very common. Resistance often isn’t about capability, but about motivation quality. If board members feel pushed into fundraising, that triggers controlled motivation (low quality motivation) i.e. obligation, guilt, or fear of judgment, which often results in avoidance. Instead, we need to create conditions for volitional motivation (high quality motivation) by satisfying […]
Read Full Answer
That’s a really thoughtful question, and you’re not the first to raise it. Many of our clients have been cautious about placing the ask at the very end. To address their concern, we’ve tested both approaches, and the results are clear: when the ask comes last, even if that means it appears on the second […]
Read Full Answer
Love your writing, Nick. The moments of snarkiness are MARVELOUS. And the content is very good, of course!! Simone
Thanks, Simone! The snark-to-content ratio on this one may have been a bit high… 🙂