M+R 2020 Online Benchmarks Released
On April 23d, the day the Covid-19 death count reached 50,000 in the U.S., M+R published its 2020 Online Benchmarks. [ You can also find an online session M+R did with NTEN on the study here. ]
Although the data were collected before the coronavirus outbreak and the massive tumult and tragedy that’s followed, this report is a must-read because it provides a base of information that will prove helpful –even in a future filled with massive uncertainty.
The findings in this 2020 study come from measuring and analyzing the results and experiences of 201 nonprofits across a range of sectors. The study is based on 2019 numbers . The Key Findings section is here and you’ll find the complete 2020 data are here.
The study is beautifully written and analyzed; a major feat given the stay-at-home environment in which it was prepared. So, kudos to the M+R staff who had to forego the face to face screaming, shouting and gnashing of teeth that usually accompanies great reports like this.
Here, unmasked, are some of the key takeaways, but I urge you to read the entire report, particularly for those specialty areas (Facebook, digital advertising, monthly giving, etc.) that may pertain to your organization. And, you may want to compare it to M+R’s 2019 Online Benchmarks that Nick covered in last year’s post
Key Takeaways
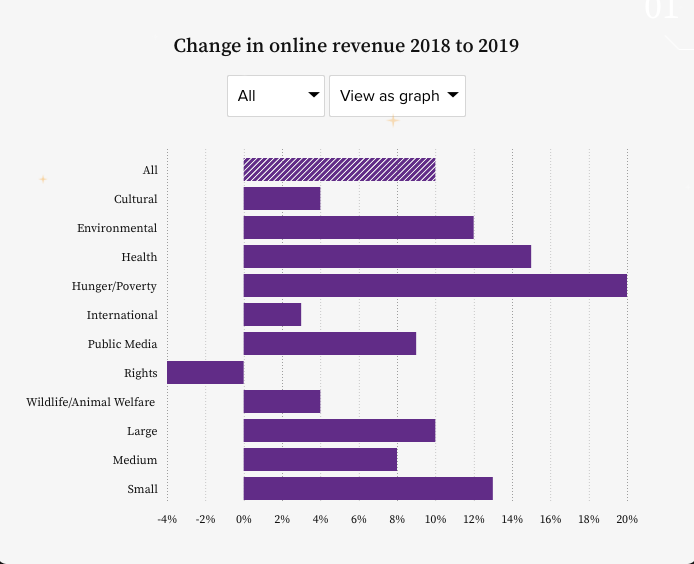
Total online revenue grew by 10% in 2019 compared with growth of only 1% in 2018. You’ll recall that over the previous decade digital had experienced double-digit growth.
Email fundraising response rates increased by 1%–a first for this metric, although as M+R notes, “some sectors reported sharp declines.”

FACEBOOK. Facebook giving (of which the Agitator ain’t a big fan because they, not you, own key data) accounted for 3.5% of all online revenue—last year it was around 2%. Donation traffic is heavily concentrated around Giving Tuesday and ‘especially significant’ for the Health sector.
Factoid: Here’s an interesting bit for those board members who think you should be ramping up your Facebook spend: the “typical Facebook Fundraiser effort attracts an average of six donors.” Each donor gives an average of $30.
On the non-money front, Facebook posts for nonprofits reached fewer nonprofit followers in 2019 –an average of 9,100 for every 100,000 constituents.
WEB TRAFFIC AND DEVICES. Organic traffic (website traffic generated by unpaid search results accounted for 44% of all nonprofit website visits in 2019. And half of all those visits came from mobile devices –an 11% increase over 2018. HOWEVER…users on desktop devices made up the majority of donation transactions (61%) and revenue (69%)
As the folks at M+R aptly note: ‘there are plenty of ways to increase the gravitational pull of your website, from search engine optimization to content marketing to awareness to advertising that increases your general salience.”
Factoid: 1 in every 588 organic website visitors (that’s 0.17%) made a donation, generating an average of $0.30 per visitor.
TEXT MESSAGING. Text messaging audiences grew by 26% in 2029. Compare this with the growth in Facebook audiences of just 4% and a decline in email list sizes by 2%. Despite this growth please note that nonprofits had just 72 mobile subscribers for every 1,000 email addresses.
M+R also notes that the power of mobile messaging is enhanced by tools like GetThru and Hustle that enable volunteers and staff to conduct one-on-one conversations with supporters. A trend the Agitator thinks well worth exploring in this strange, new age we’re entering
Factoid: Click-through rates for text messages were 4.2% for fundraising messages and 9.8% for advocacy messages—far higher than the 0.56% for email messages. No way of knowing at this point whether this will diminish significantly as the ‘newness” wears off and volume increases.
DIGiTAL ADVERTISING. Spending on digital ads increased by 17% I 2019, with nonprofits spending an average of $0.07 for ever $1 raised in online revenue. This is not a direct measure of ROI. On average the cost to acquire a new lead through digital advertising was $2.48.
Digital advertising, as opposed to spending on social media, is largely the province of larger organizations with smaller organizations spending most of their digital ad budget (96%)on social media. (The study goes into great detail on advertising and if you’re into this you should read the full report)
Factoid: Return on digital ad spend was highest for Search ads ($3.59), followed by Display Ads ($07.74, Social Media ($0.70) and Video ($0.53).
EMAIL MESSAGING. In the data section of the report you’ll find some eye-opening and valuable information on email fundraising. In 2019 both email list size (-2%) and email volume (-2.1%) declined over 2018. As regular Agitator readers know, we think this decline is volume is a good thing and that as it declines results should go up. In 2019 that’s exactly what happened. noted this decline was a good thing; Despite the volume decline email response rates went up by1% for fundraising emails and 2% for advocacy emails.
Monthly Giving. If you haven’t gotten the message about the importune of annual giving giving (particularly NOW!) then here’s another fact that should help persuade you to get cracking. Revenue from monthly gifts increased by 22%–twice as fast as revenue from one-time gifts (8%). Monthly giving accounted for 17% of all online giving in 2019.
As an indicator of the difference monthly giving can make consider this fact: Public Media nonprofits, organizations that go intensely after monthly gifts, generated the highest return of $124 per 1,000 messages sent compared to $45 in revenue for the overall nonprofit average.
We’re once again giving the M+R team an Agitator Raise for this impressive and helpful contribution to our understanding and practice of digital fundraising and advocacy.
Thank you M+R.
Roger
P.S. We also remind you that the M+R 2019 Benchmarking report does not include other channels (direct mail, telemarketing, DRTV, print, etc)—channels that account for 80+% of total fundraising revenue.
Unfortunately, there is no benchmark report out there that looks all channels individually or by multi-channel performance. That’s because virtually every benchmarking report is prepared by specialists in a particular channel. M+R in digital. Blackbaud, largely in digital and most of the CRMs flog their ability to quickly and easily send email fundraising and advocacy messages.
I note this because I fear –and have expressed those fears in posts—that the inexperienced fundraiser and all too many organizations are exposed to the advertising and marketing of the digital tech and digital consulting firms and may naively believe that digital is the be all and end all. Of course it is not. 80+% of all money raised comes through channels other than digital.
Although digital is becoming more and more important –especially now in the Age of Coronavirus—there are other far more valuable channels, far larger workhorses for fundraising. The most important –and increasingly overlooked –is direct mail and I’ll come back to that in future posts where we’ll discuss the power of combining digital with direct mail.
One response to “M+R 2020 Online Benchmarks Released”
Behavioral Science Q & A
Thanks so much for raising this. Yes, capturing donor information can be helpful for stewardship like newsletters, thank-you letters, impact updates. But how you ask matters. Forcing full data capture introduces friction that can significantly depress conversion, many donors may simply abandon the process. Beyond the friction itself, required fields also shift the emotional experience […]
Read Full Answer
Unlike holidays that everyone already knows, Giving Tuesday is a created event. Many donors recognize the name but not the exact timing, so referencing it becomes a helpful cue. It serves as a reminder and taps into social norm activation (“everyone’s giving today”), which boosts response. However, we still want it paired with the mission, […]
Read Full Answer
When a subject line leads with the match (“Your gift matched!”), it risks triggering market-norm thinking: the sense that giving is a financial transaction rather than an act rooted in values, identity, and care. This shift reduces intrinsic motivation and, over time, can weaken donor satisfaction and long-term engagement. It also makes the email indistinguishable […]
Read Full Answer
There’s no evidence that QR codes suppress mid-value giving; all available research suggests they either help or have no negative effect. In fact, behavioral and usability research consistently shows the opposite: reducing friction at any point in the donation process increases completion rates and total response. And that has nothing to do with capacity and […]
Read Full Answer
What you’re experiencing is very common. Resistance often isn’t about capability, but about motivation quality. If board members feel pushed into fundraising, that triggers controlled motivation (low quality motivation) i.e. obligation, guilt, or fear of judgment, which often results in avoidance. Instead, we need to create conditions for volitional motivation (high quality motivation) by satisfying […]
Read Full Answer
That’s a really thoughtful question, and you’re not the first to raise it. Many of our clients have been cautious about placing the ask at the very end. To address their concern, we’ve tested both approaches, and the results are clear: when the ask comes last, even if that means it appears on the second […]
Read Full Answer
The last sentence made my day! 🙂 Looking forward to future topics related to Direct Mail. thx