Award-Winning Blog


Does Your Test Know What It’s Testing?

Before you run a fundraising test do you specify what behavior is supposed to change?  Is it response rate, average gift, maybe both? If you can’t answer that before the test goes out then that tells you something. That “something” usually shows up in the test results that report on response rate, average gift, revenue, […]

Learn More

Tolstoy, Attrition and the Myth of the Average Donor

“All happy families are alike; each unhappy family is unhappy in its own way.” That is the opening line of Tolstoy’s Anna Karenina. He then spent more than 800 pages cataloguing the many available routes to domestic misery. Fundraising has adopted its own version of the Tolstoy principle: successful donor relationships all look roughly alike, […]

Learn More

Your Database Knows the Gift But Does it Know the Donor?

Your database knows someone gave $43 at 9:17 p.m. after clicking an email on an iPhone. It may also know the campaign, payment method, landing page and which subject line got the click. That is a great deal of information about the transaction and very little about the person. We tend to collect what is […]

Learn More

Democracy Doesn’t Need Your Talking Points. It Needs Your List.

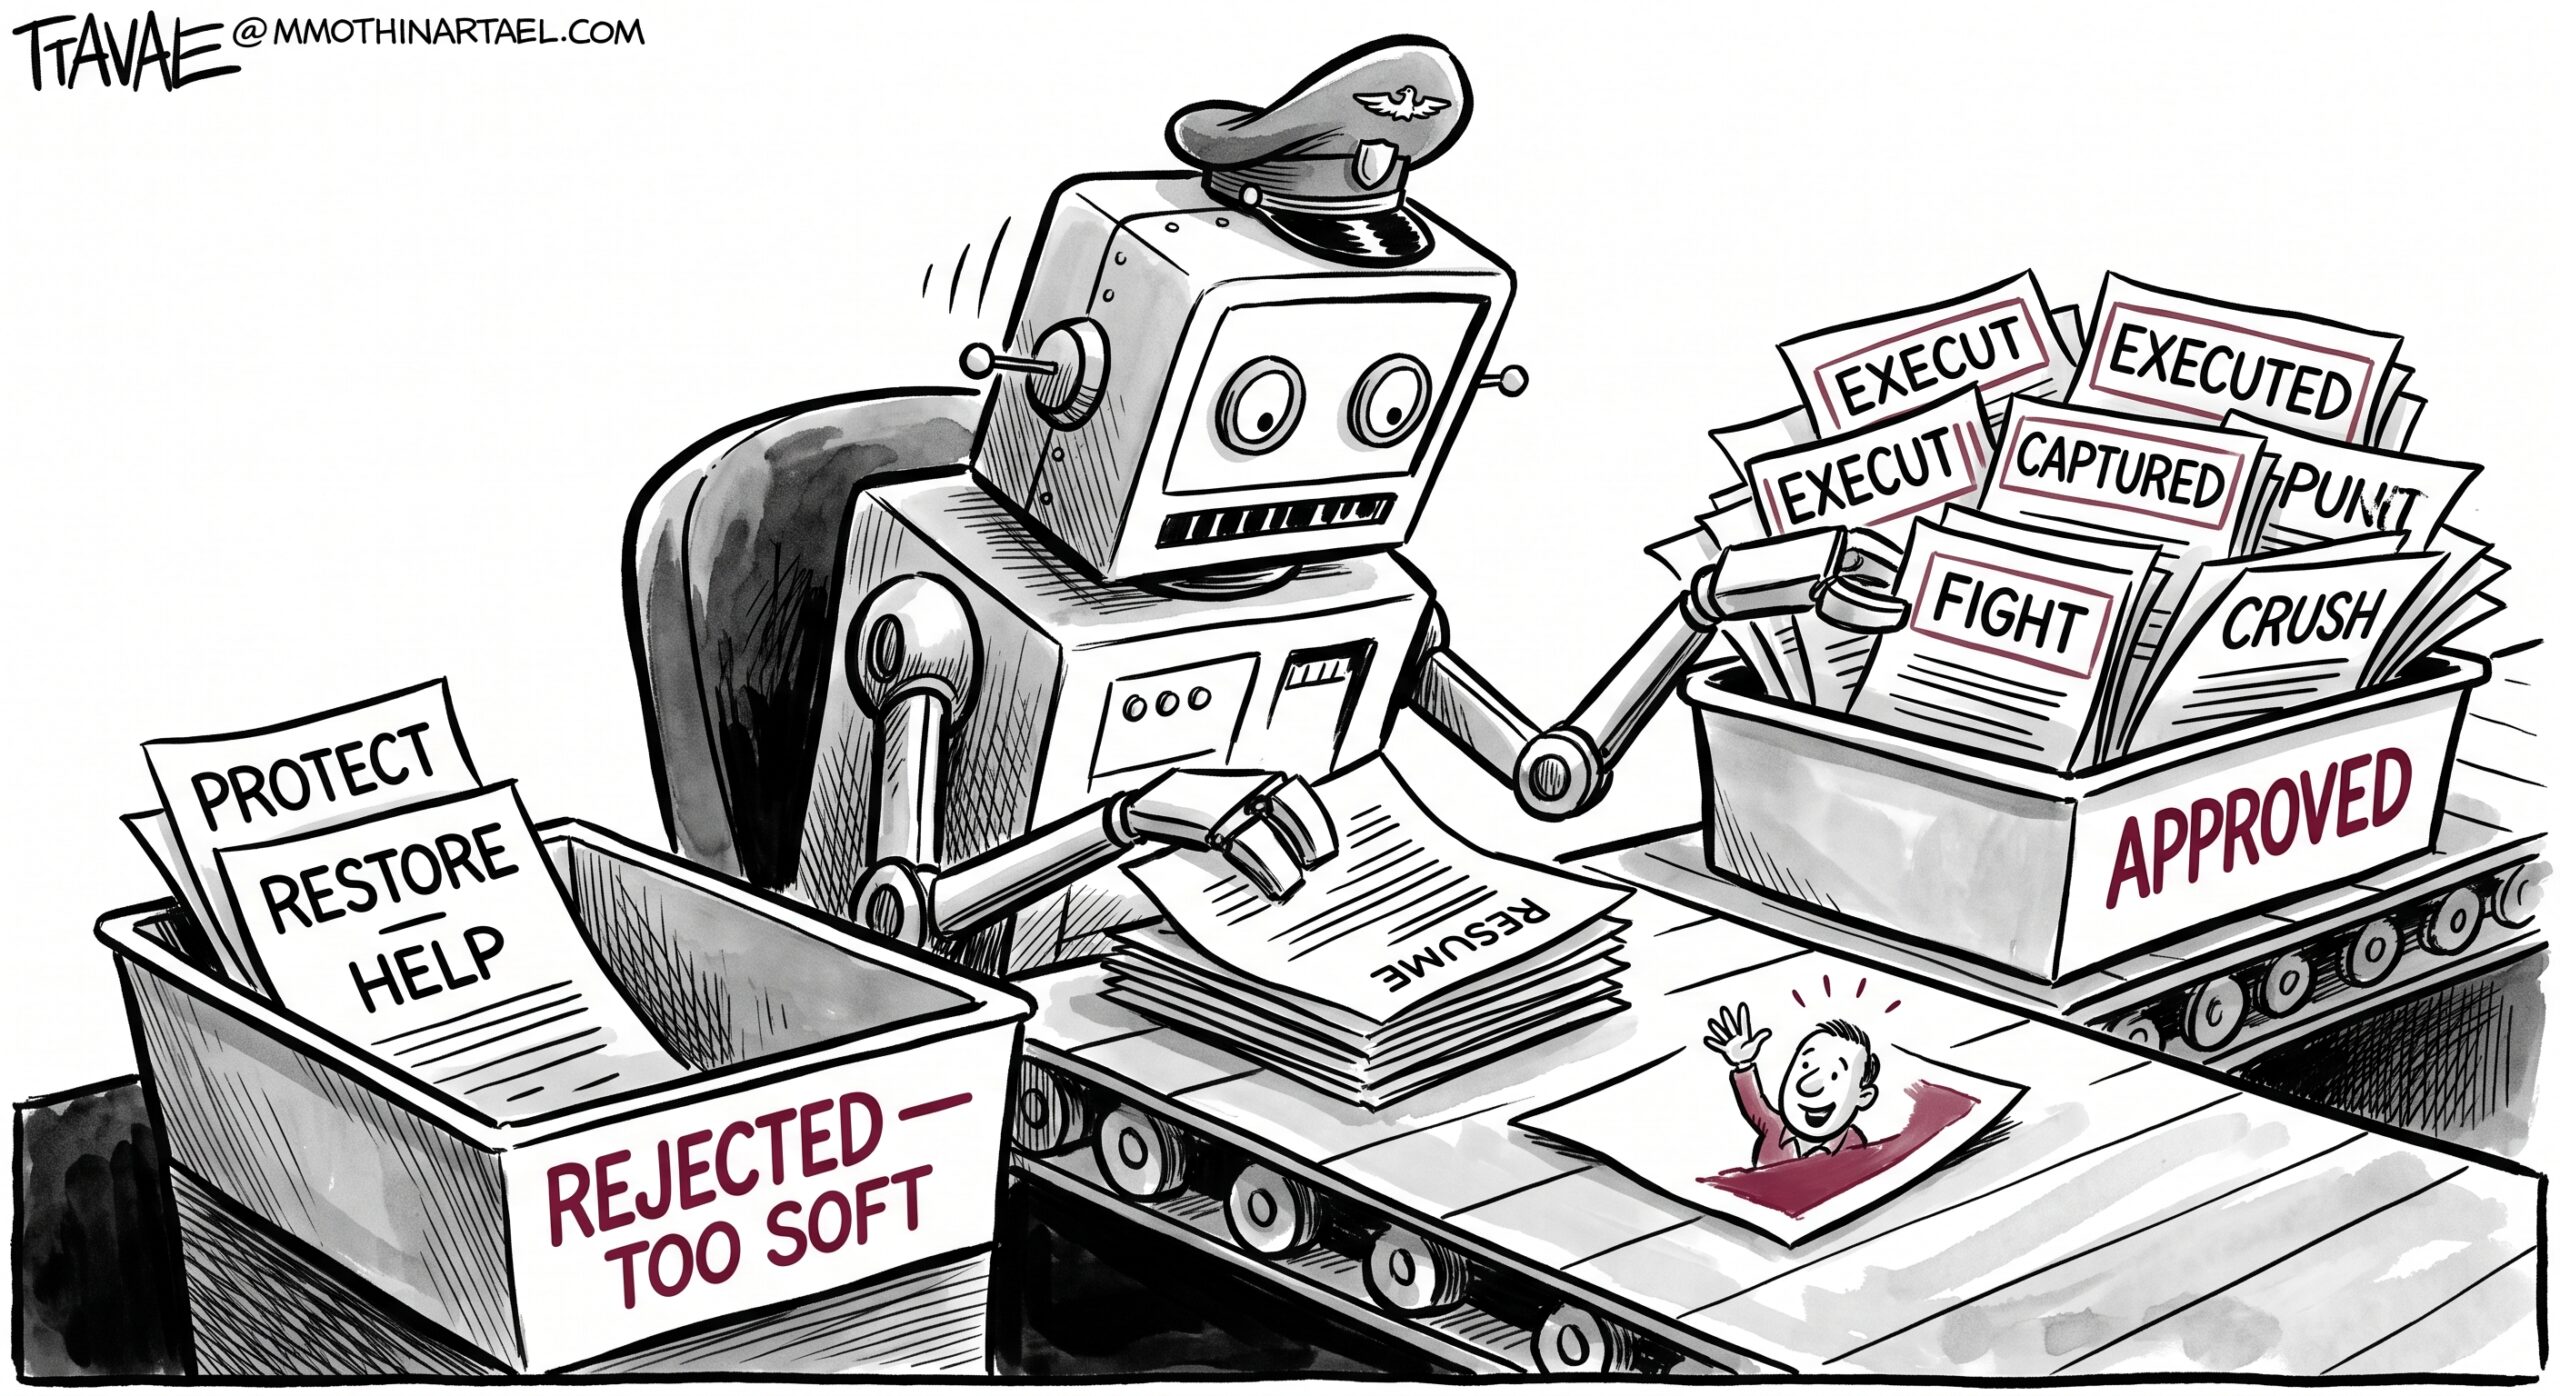
     Somewhere in some nonprofit’s Slack channel right now, someone is drafting talking points on “the erosion of voting rights.” Somebody else is scheduling a panel: Protecting Democracy in the Midterms — A Conversation. Nobody in that channel has yet asked a single supporter to show up as a poll worker on November 3. […]

Learn More

You Fixed the Metric but the Problem Moved

California banned thin plastic grocery bags. The number of those bags fell by roughly 40 million pounds a year. Look only at the checkout counter and the intervention worked beautifully. Shoppers, however, had been using some of those bags again. They lined small trash cans, handled pet waste, and performed the various grubby jobs for […]

Learn More

Pretty Wins

Fundraising runs on numbers. We collect them, slice them, chart them and eventually put them in front of someone who is expected to make a decision. We like to imagine the data speaks for itself. Alas, it doesn’t.  Turns out the chart speaks too, and it has a loud voice. Research across topics, industries, media […]

Learn More